Rachel C. Lombardi, author
Introduction
Over 728 billion cubic meters (bcm) of dry natural gas was consumed in the United States (U.S.) in 2013, and 24% of U.S. household energy is produced by natural gas (USEIA, 2013; Jaramillo et al., 2007). Due to a growing demand for natural gas, Dominion Inc., in partnership with Duke Energy, Piedmont Natural Gas, and AGL Resources, is planning to develop the Atlantic Coast Pipeline (ACP), which is estimated to be in service by 2018 (Adams et al., 2011; Chmura, 2014). This natural gas pipeline would provide natural gas to West Virginia, Virginia and North Carolina. The planned pipeline will be buried infrastructure and will be approximately 892 kilometers long; it will have a 107-centimeter diameter in Virginia and it has the capacity for 42,000,000 bcm/day. Dominion has identified a 122 meter –wide corridor through which the pipeline will run, which falls within ten Virginia counties: Highland, Augusta, Nelson, Buckingham, Cumberland, Prince Edward, Nottoway, Brunswick, Dinwiddie and Greenville (figure 1).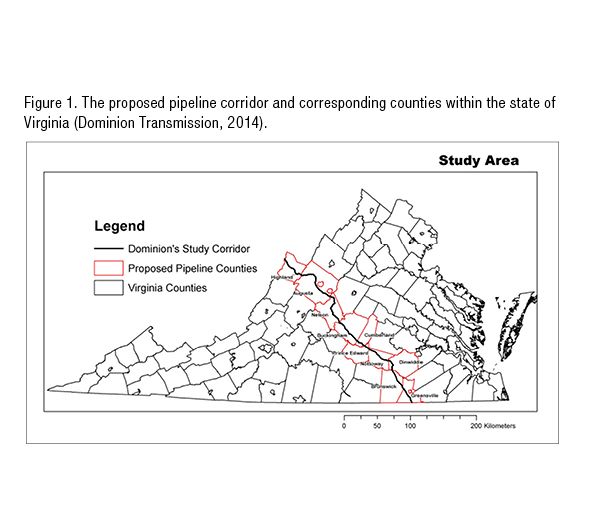
An economic analysis by Chmura Economics & Analytics identifies many anticipated benefits associated with the pipeline construction (Chmura, 2014). It is expected that the ACP will increase competition amongst natural gas companies and increase flexibility of buyer options, creating the potential to lower gas prices. Between 2014 and 2019 an estimated 8,800 jobs, $1.4 billion in total pipeline spending and $14.6 million in individual and corporate income tax revenue will be introduced into Virginia’s economy (Chmura, 2014). After the construction period ending in 2019, pipeline operation will create an estimated 118 jobs, $37.8 million, and $233,000 in tax revenue per year (Chmura, 2014).
There are also potential environmental consequences associated with the pipeline construction. One such consequence is the necessity to clear cut forests in order to construct the pipeline, which leads to habit fragmentation which will decrease biodiversity (Jantz et al., 2014). Excavation for the pipeline disturbs the soil, leading to potential erosion. Offsite soils are often brought in during construction and can change the natural soil composition (Jantz et al., 2014). Additionally, construction activities compact soils, which has negative effects of vegetation rooting and soil saturation and can ultimately lead to increased run-off and erosion (Jantz et al., 2014). Finally, the production and transport of natural gas are accompanied by the release of methane gas, a potent greenhouse gas (Howarth et al., 2011).
Natural gas is often considered a preferred fossil fuel for consumption as the U.S. transitions to lower carbon emission energy practices, as it produces fewer carbon dioxide (CO2) emissions than coal during the combustion process (Jaramillo et al., 2007). However, the combustion of natural gas releases more methane than coal, and methane is a more potent greenhouse gas (GHG) than CO2 as it has the potential to cause 20% more heating of the atmosphere when considered gram for gram (EPA, 2014; Howarth et al., 2011). Unfortunately, there is little knowledge regarding the magnitude of methane emitted by natural gas; therefore, a rush to utilize natural gas in an attempt to cut down on CO2 emissions exacerbate climate change, as methane will cause greater heating in less abundance (Howarth et al., 2011).
Conventional natural gas was the first source of natural gas and was found in easily accessible reservoirs of hydrocarbon gas which had escaped their deeper source beds. It was consumed widely throughout the 20th century, with production reaching 6 trillion cubic meters in 1970 (Kerr, 2010). Production dropped to 3 trillion cubic meters in 2008 due to diminishing reserves (Kerr, 2010). Consequently, shale natural gas, a natural gas source still trapped within its source bed, became the “unconventional” supplement to the declining conventional reservoirs; however, it was only accessible via the process of hydraulic fracturing. During the process of hydraulic fracturing, approximately 11 to 15 million liters (3 to 4 million gallons) of pressurized water mixed with sand and chemicals are used to release natural gas (Kerr, 2010). This process has been shown to emit up to 30% more methane than the recovery of conventional natural gas (Howarth et al., 2011).
Another concern regarding the ACP is that the corridor passes along the edges of the Central Virginia Seismic zone, which has a higher potential for seismic activity than the rest of Virginia (USGS, 2014b). The Central Virginia Fault zone is an intraplate fault zone, which is an area of strain within a continent’s interior (Talwani, 1999). An intraplate fault zone can often be more damaging to humans than an interpolate fault (which is strain along a plate boundary) due to the general lack of understanding and preparedness among communities (Talwani, 1999).
In addition to the Central Virginia Fault zone, the pipeline is projected to cross numerous rivers, most of which are located within the Chesapeake Bay watershed, and several conservation areas. In the event that the integrity of the pipeline was comprised via seismic activity, normal wear and tear, etc., water quality of nearby water bodies would be threatened. Conservation lands, where intact forests are protected, serve a vital role in biodiversity and watershed health. Often, forests are conserved for the purpose of providing clean water to cities within the watershed minimizing the need for extensive water treatment costs (Dudley and Stolton, 2003).
This project aims to characterize environmental risk factors associated with the construction of the ACP pipeline via a spatial analysis.
 Methods
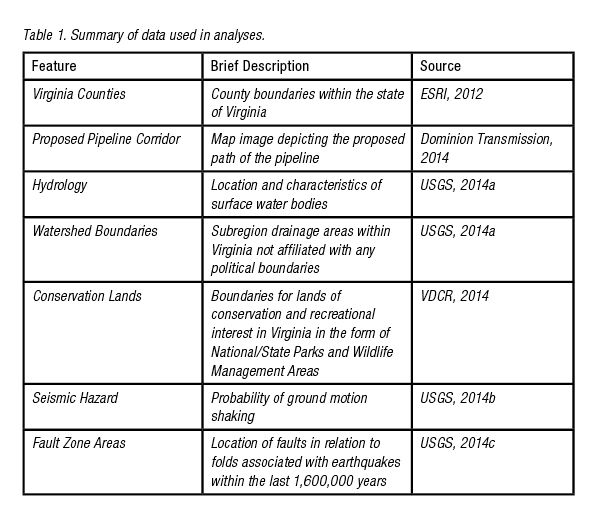
This project focused on the portion of the pipeline located within the state of Virginia—specifically, the ten counties listed previously. All analyses were performed using ArcGIS 10.1, a geographic information systems software package (ESRI, 2012). Because the pipeline is located predominantly in the southern portion of Virginia, all maps are projected in NAD 1983 StatePlane Virginia South FIPS, as this projection resulted in the least distortion within the area of interest. Table 1 summarizes the data acquired for analysis.
Map images provided by Dominion of the ACP study corridor were used to digitize a polyline feature in ArcMap 10.1. The digitized study corridor was superimposed on the hydrology dataset to determine where intersections occurred. The study corridor was also overlaid with the conservation land dataset to determine which protected areas would be affected by construction and maintenance of a pipeline. Finally, a seismic hazard map was symbolized as a chloropleth map to show areas of greater probability of ground motion due to strain release, and the fault area dataset was added to depict general fault zone locations. The study corridor and hydrology data were overlaid onto this layer as well to show areas at greatest risk of infrastructure damage due to seismic activity, as well as rivers that would be subject to contamination in the event of pipeline failure.
 Results/ Discussion
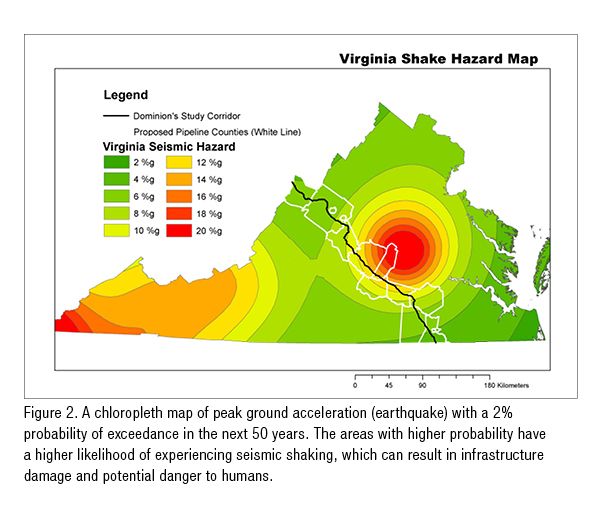
Virginia has faults that trend from NE to SW and extend from NW of Goochland to Prince Edward and Buckingham County, commonly referred to as the Central Virginia Seismic Zone. Figure 2 displays the locations of these faults as well as peak ground acceleration (PGA) of areas with at least 2% probability of exceedance within the next 50 years. PGA is a measurement of earthquake acceleration of the ground, or shaking intensity. PGA is measured in percent gravity (%g), which is related to the Modified Mercalli Intensity Scale to determine perceived shaking in a given area (USGS, 2014d). Therefore, 6 %g areas would be experiencing moderate (3.9–9.2 %g) perceived shaking and in the 10 percent gravity areas would be experiencing strong (9.2–18 %g) perceived shaking. The proposed pipeline corridor falls within an area of Virginia that has a PGA ranging from approximately 4 to 14 % g relating to moderate to strong perceived shaking. Table 2 shows the percentage of pipeline located within each shake hazard rating.
While there is certainly the potential for seismic shaking in the Central Virginia area, there is very little, if any, information available regarding the hazards associated with natural gas pipelines in areas prone to seismic shaking. A study prepared for FEMA reports a lack of adequate earthquake consideration, if any at all, in pipeline engineering standards in the central and eastern U.S. due to an infrequency of seismic activity (Yokel, 1992). However, these areas have historically seen earthquakes large enough to cause strong shaking and serious damage (Talwani and Schaeffer, 2001). A buried pipeline will typically move with surface seismic wave; however, if shear (S) waves, which travel perpendicular to the surface, were to rupture the pipeline, groundwater would be at risk of contamination similar to the observed phenomenon of groundwater contamination due to leaking well infrastructure. Contamination would include high levels of dissolved methane, which has explosive potential (Osborn et al., 2011). Additionally, nine valves found along the pipeline in Virginia could easily be broken in a seismic event, which will release highly flammable methane gas in the air. An automatic shut-off valve has the potential to prevent this, but it would require detection equipment to have an extremely rapid response to change in pressure. Response to a rupture would take a considerable amount time to repair even if discovery of failure was immediate. These failures would be catastrophic to the environment as a rupture of the pipeline transporting 42,000,000 bcm/day of natural gas would immediately leak a large magnitude of contaminants.
Furthermore, studies have shown that surface processes causing sedimentation of continental margins have been correlated with increased intraplate seismicity (Westaway, 2006; Calais et al., 2010; Guerroué and Cobbold, 2006). For example, deglacial melts occurring between 16 and 10 billion years ago in North America lead to extensive sedimentation in the Mississippi delta, causing flexure in the lithosphere. This triggered reactivation of the New Madrid Fault Area (located around the intersection of Kentucky, Arkansas, Tennessee, Illinois and Missouri), which caused a historic increase in the number of earthquakes in that area (Calais et al., 2010). In other words, erosion in one area and the resulting loading downstream can result in crustal deformation, thus causing strain in fault areas and leading to increased seismic activity. As the Chesapeake Bay has historically experienced significant se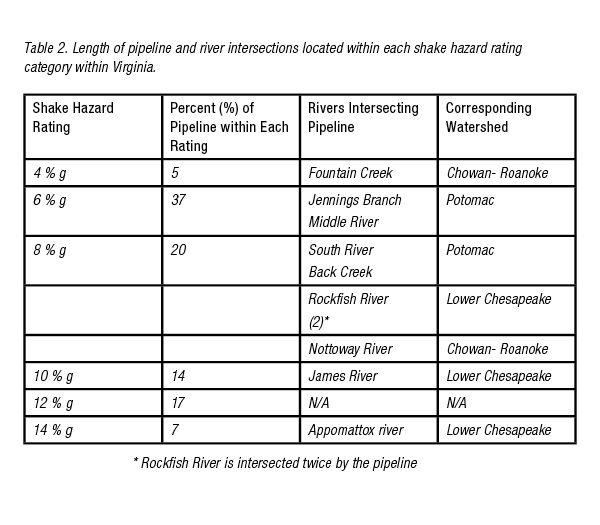 dimentation and erosion due to erosive agricultural practices in the late 1700’s through the late 1800’s, it is possible that the Central Virginia area could experience an increase in the frequency and intensity of seismic activity in the future. If realized, this scenario would create an even greater chance of pipeline damage due to seismic shaking.
Nine rivers traverse the proposed ACP study corridor, with the Rockfish River being intersected twice (Table 2). As shown in Figure 3, four of the rivers are tributaries of the Potomac River, all within the Chesapeake Bay watershed (ICPRB, 2012). The Rockfish, James and Appomattox Rivers also contribute to the Chesapeake Bay, which is the largest estuary and one of the largest fisheries in the United States (Baird and Ulanowicz, 1989). Dominion released a report that detailed the two methods by which the pipeline will cross a waterbody: trenching through a waterbody and boring underneath the waterbody (Dominion Transmission, 2014). The proposed pipeline serves as a threat to these rivers (especially those subjected to trenching) and, ultimately, the Bay, during both the construction and operational periods. During construction, sedimentation of the rivers and streams can occur via the trenching process or the transportation of excess soil during rain events. Any machine failure in or around the river can release contaminants such as gasoline or hydraulic fluids. Additionally, riparian vegetation will be removed to allow construction equipment to cross the waterbody and temporary bridges to be installed, which increases the risk of streambank erosion.
Scientists at the Fernow Experiment Forest in West Virginia were able to observe construction of a natural gas pipeline, albeit at a much smaller scale than the proposed ACP, that occurred within a forested area and intersected several wetlands (Adams et al., 2011). Despite the fact that construction was performed during a period without rainfall and erosion control measures were utilized, an estimated 2.1 metric tons per hectare of soil erosion still occurred. This study shows that, despite preventative measures, erosion can be a primary concern with respect to the construction phase of a pipeline.
The proposed pipeline can serve as a threat to the rivers it intersects even after construction is complete. Increased urbanization in Virginia can cause higher magnitudes of stormwater flows in rivers, which may alter the geomorphology of a stream channel or floodplain via streambank incision, channel cut-offs, or channel migration. These geomorphic changes could potentially expose buried pipeline, thereby exposing the pipeline to the erosive power of running water. 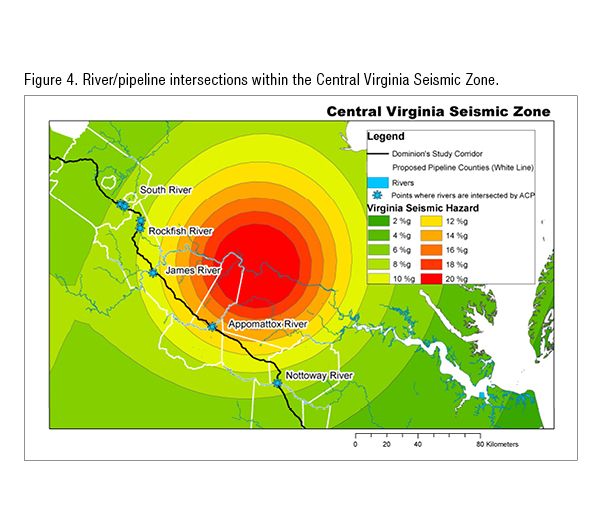 Figure 4 depicts the intersections of the proposed pipeline with major rivers within the Central Virginia Seismic Zone. Seven of the ten rivers intersect in this area, all of which are tributaries of the Chesapeake Bay, correspond to a shake hazard rating of 8 %g or greater. Waterbody crossings associated with a higher probability of seismic activity are at increased risk of contamination, as seismic activity can damage the pipeline, thereby introducing natural gas directly to the waterbody.
The proposed ACP pipeline will traverse several protected areas that are vital in providing balanced ecosystems and clean water to the Chesapeake Bay Watershed (Figure 5) (Dudley and Stolton, 2003). In September 2015, Dominion plans to file for right-of-way grants to land within the George Washington National Forest (GWNF), Appalachian Corridor, and Blue Ridge Parkway (Dominion Transmission, 2014). The GWNF and other protected forests will be facing major disruption to their ecosystems during construction of the pipeline, as a section of land 33.5 m wide must be clear-cut (Dominion Transmission, 2014).  Tree growth will be prohibited in this area for the entire stretch of the pipeline (Dominion Transmission, 2014). Spatial analyses revealed that the length of GWNF that must be cleared for the proposed pipeline would be approximately 20 km, or an area of approximately 67 ha. The Appalachian Corridor and Blue Ridge Parkway will lose approximately 2.2 ha and 0.76 ha of conservation land, respectively, to clear-cutting operations. Another protected forest in the ACP’s path is Highland Wildlife Management Area, approximately 2.4 ha of which will be subject to clear-cutting; however, Dominion has not yet applied for local permits in this area. In total, approximately 72.6 ha of conservation land will be subject to clear-cutting due to the ACP.
Potential consequences of clear-cutting include increased erosion, which can be extremely harmful to a watershed, as discussed previously, as well as an increased “edge” effect (Adams et al., 2011). The “edge” effect is the removal of habitat from an intact forest, which causes fragmentation and exposure to abiotic factors such as solar radiation, and can potentially lead to biological changes in predation, fauna success, pollination and species competition (Murcia, 1995). Several endangered species inhabit the GWNF and could be at risk due to removal of tree habitat and trenching associated with pipeline construction (which may potentially affect karst caves), including the Cow Knob Salamander, James spiny mussel, Indiana Bat, Northern Long-Eared bat, and Virginia Big-Eared Bat (Wild Virginia, 2014). Additionally, the quality of water leaving the forests could be diminished due to logging and construction efforts for the pipeline (Fulton and West, 2002). Forestry, or logging, in national forests is comparable to the activities that will occur in pipeline construction, including tree removal, the presences and use of vehicles, and the destabilization of soil layers. These activities can contaminate water leaving the area by adding sediments, excess nutrients, equipment fluids and thermal pollution (Fulton and West, 2002).
Conclusion
There are numerous economic benefits associated with the construction of the Atlantic Coast Pipeline; however, the risk factors to Virginia’s environment are equally numerous. The likelihood of seismic activity in the region of the pipeline’s location is a cause for concern, as the pipeline could sustain damage in the event of a seismic event, leading to environmental contamination. The intersection of the pipeline and waterbodies is also problematic, as the waterbodies are subject to the consequences of upstream erosion, geomorphological changes, and natural gas contamination. Any of these consequences could jeopardize the use of a waterbody for drinking water, recreation or food. As the majority of these waterbodies contribute to the Chesapeake Bay, there could be regional and national consequences and associated negative environmental impacts as well as local. Finally, the health of several protected lands and national forest ecosystems is at risk as well, as approximately 73 ha will be disrupted and deforested during the construction of the ACP.
There are certain economic benefits that accompany the construction of the pipeline; however there are economic costs that come with the pipeline as well in the form of mitigating environmental hazards and pollution. Forest and surface water degradation, groundwater contamination, and negative impacts on the Chesapeake Bay are all potential costs that would burden the economy and society as a whole. As a society, we must determine how much risk we are willing to take to boost our local and regional economies. Do the economic benefits of the Atlantic Coast Pipeline outweigh the costs? It is a question that our society must ask itself, and there is no easy answer.
References
Adams, M., Edwards, P., Ford, W., Johnson, J., Schuler, T., Gundy, M. and F. Wood. 2011. Effect of Development of a Natural Gas Well and Associated Pipeline on the Natural and Scientific Resources of the Fernow Experimental Forest. Newtown Square, PA: U.S. Forest Service.
Baird, D., and R. Ulanowicz. 1989. The Seasonal Dynamics of The Chesapeake Bay Ecosystem. Ecological Monographs, 59(4): 329-364.
Calais, E., Freed, A., Arsdale, R., and S. Stein. 2010. Triggering of New Madrid seismicity by late-Pleistocene erosion. Nature, 466: 608-611.
Chmura. 2014. The Economic Impact of the Atlantic Coast Pipeline in West Virginia, Virginia, and North Carolina. Richmond, Va: Chmura Economics & Analytics.
Dominion Transmission, Inc. 2014. Resource Report 1: General Project Description. Natural Resource Group.
Dudley, N. and S. Stulton. 2003. Running Pure: The Importance of Forest Protected Areas to Drinking Water. Washington, D.C: The World Bank/ WWF Alliance.
EPA. 2014. Overview of Greenhouse Gases. Washington, D.C.: U.S.
Environmental Protection Agency. Available at: http://epa.gov/climatechange/ghgemissions/gases/ch4.html. Accessed 11 January 2015.
ESRI®. 2012. ArcMap™. Ver. 10.1. Redlands, CA.: Esri, Inc.
Fulton, S. and B. 2002. Chapter 2: Forestry Impacts on Water Quality. In Southern forest resource assessment, 501- 517. David N. and Greis, J. G., eds. Asheville, NC: U.S. Department of Agriculture, Forest Service, Southern Research Station.
Guerroué, E. L. and P. R. Cobbold. 2003. Influence of erosion and sedimentation on strike-slip fault systems: insights from analogue models. Journal of Structural Geology. 28: 421-430.
Howarth, R., Santoro, R. and A. Ingraffea. 2011. Methane and the greenhouse-gas footprint of natural gas from shale formations. Climate Change. 106: 679-690.
ICPRB. 2012. General Facts & FAQs. Interstate Commission on the Potomac River Basin. Available at: http://www.potomacriver.org/facts-a-faqs/faqs. Accessed 11 January 2015.
Jantz, C., Kubach, H., Ward, J., Wiley, S., and D. Heston. 2014. Assessing Land Use Changes Due to Natural Gas Drilling Operations in the Marcellus Shale in Bradford County, PA. The Geographical Bulletin. 55: 18-35.
Jaramillo, P., Griffin, W., and Matthews, H. 2007. Comparative Life-Cycle Air Emissions Of Coal, Domestic Natural Gas, LNG, And SNG For Electricity Generation. Environmental Science & Technology, 41(17): 6290-6296.
Kerr, R. 2010. Natural Gas From Shale Bursts Onto the Scence. Science. 328(5986): 1624-1626.
Murcia, C. 1995. Edge effects in fragmented forests: implications for conservation. TREE. 10(2: 58- 62.
Osborn, S., Vengosh, A., Warner, N., and R. Jackson. 2011. Methane contamination of drinking water accompanying gas-well drilling and hydraulic fracturing. Proceedings of the National Academy of Sciences. 108(20): 8172 – 8176.
Rozell, D., and Reavan, S. 2012. Water Pollution Risk Associated with Natural Gas Extraction from the Marcellus Shale. Risk Analysis, 32(8), 1382-1393.
Talwani, P. 1999. Fault geometry and earthquakes in continental interiors. Tectonophysics. 305: 371-379.
Talwani, P., & Schaeffer, W. (2001). Recurrence rates of large earthquakes in the South Carolina Coastal Plain based on paleoliquefaction data. Journal of Geophysical Research. 106: 6621-6642.
USEIA. 2013. International Energy Statistics. Washington, D.C.: U.S. Department of Energy. Available at: http://www.eia.gov/cfapps/ipdbproject/IEDIndex3.cfm?tid=3&pid=26&aid=24. Accessed 4 December 2014.
USGS. 2014a. Hydrography: Get NHD Data. U.S. Department of the Interior. Available at: http://nhd.usgs.gov/data.html. Accessed 4 December 2014.
USGS. 2014b. Earthquake Hazard Progam: Lower Maps and Data. U.S. Department of the Interior. Available at: http://earthquake.usgs.gov/hazards/products/conterminous/ Accessed 4 December 2014.
USGS. 2014c. Earthquake Hazard Progam: Faults. U.S. Department of the Interior. Available at: http://earthquake.usgs.gov/hazards/qfaults/. Accessed 4 December 2014.
USGS. 2014d. Shake Map Background. U.S. Department of the Interior. Available at: http://earthquake.usgs.gov/research/shakemap/. Accessed 11 January 2014.
Westaway, R. 2006. Investigation of coupling between surface processes and induced flow in the lower continental crust as a cause of intraplate seismicity. Earth Surface Processes and Landform., 31: 1480-1509.
Wild Virginia. 2014. Atlantic Coast Pipeline. Charlottesville, Va: Wild Virginia. Available at: http://www.wildvirginia.org/our-programs/dominion-pipeline/. Accessed 29 December 2014.
VDCR. 2014. Natural Heritage: Conservation Lands Shapefiles and Metadata. Richmond, Va: Virginia Department of Conservation and Recreation. Available at: http://www.dcr.virginia.gov/natural_heritage/cldownload.shtml. Accessed 4 December 2014.
VDGIF. 2015. Highland WMA. Virginia Department of Game and Inland Fisheries. Available at: http://www.dgif.virginia.gov/wmas/detail.asp?pid=28. Accessed 6 Janurary 2015.
Yokel, F and R. Mathey. 1992. Earthquake Resistant Construction of Gas and Liquid Fuel Pipeline Systems Serving, or Regulated by, the Federal Government. Washington, D.C.: U.S. Department of Commerce.