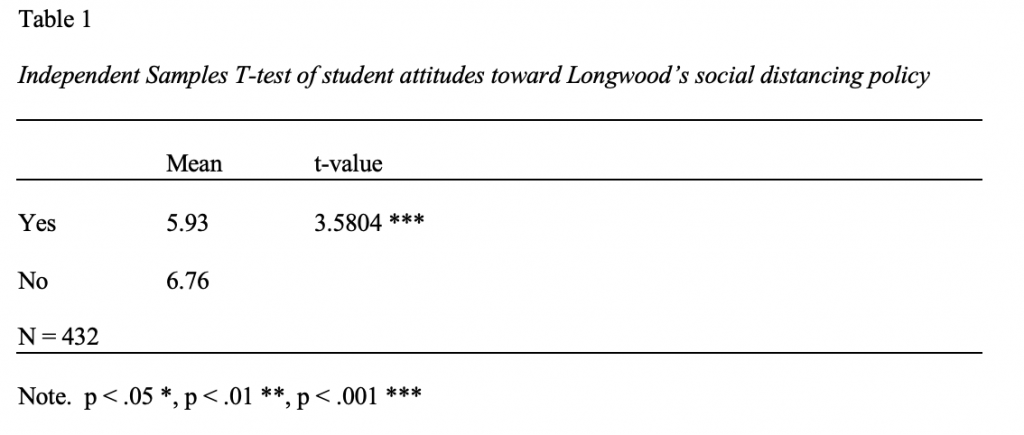
Quantitative data was collected in the form of close-ended questions. In this questionnaire, a total of 432 responses were gathered. The dependent variable in the research was the effectiveness of COVID policy and the survey question was “On a scale of 1-10, how beneficial do you think the policies Longwood enacted are at reducing the spread of COVID-19?” Its attributes included 0-10 0= Not at all while 10= Extremely beneficial. The independent variable from the questionnaire was Longwood’s social distancing policy. The survey question used for this section was “Do you know any Longwood student who has attended a social event with more than 50 people that were not socially distancing on or near campus this semester?” Its attributes included “Yes,” “No,” “Maybe,” and “Prefer not to answer.” The data from the independent variable was recoded from Yes, No, Maybe, and Prefer not to answer to “Yes” and “No” in RStudio. An independent sample t-test was run and these are my findings: the mean found for “Yes” was 5.93, the mean found for “No” was 6.76, while the t-value found was 3.584. When the t-value is given, the p-value is also given which was .00039. The p-value is the probability of obtaining the results within the spread of data. Alpha levels, .5, .01, and .001, are constant levels of comparison to the p-value to find whether or not the difference found between the means is significant. Based on my data, the p-value of .00039 is less than all three constant alpha levels so this means that there was a significant difference found between the means. In other words, we reject the null hypothesis and retain the research hypothesis.