Introduction
The bacteria classified within the genus Salmonella are gram-negative, facultative, rod-shaped bacteria (Yingqin et al., 2012) within the well-documented Family Enterobacteriaceae. However, the taxonomy of Salmonella is somewhat complex. The current taxonomic scheme consists of the genus Salmonella containing two species — S. enterica and S. bongori (Bhaduri et al., 2009). Within the species S. enterica, there are seven groups or subspecies (ssp.), which are further composed of serovars. Currently, there are 2,579 recognized Salmonella serovars (Dera-Tomaszewska, 2012). The most common pathogens for humans are found in Group 1, which contains all of the serovars of Salmonella enterica ssp. enterica (Miljković-Selimović et al., 2010). When citing a particular serovar, one may choose to state the entire genus, species, subspecies, and serovar such as in Salmonella enterica ssp. enterica serovar Typhimurium, or one can abbreviate with genus, subspecies, and serovar such as in S. enterica serovar Typhimurium.
The genus is well known as a human pathogen causing “salmonellosis” and is most commonly associated with cases of gastroenteritis, but can also include self-limiting enterocolitis, typhoid fever, or bacteremia (Lee et al., 2012). It is currently a topic of debate as to whether all serovars of Salmonella enterica are pathogenic to humans as stated by Bhowmick et al. (2010) and Hassanein et al. (2011) or whether only certain serovars can cause illness as stated by Cabral (2010). The two serovars that are most clinically relevant are S. enterica ssp enterica serovars Typhimurium and Enteritidis (Madigan et al., 2006). According to the World Health Organization (2005), 61% of reported cases of salmonellosis are contributed to the S. enterica serovar Enteritidis, while S. enterica serovar Typhimurium contributes to 18% of reported cases.
The reservoirs for Salmonella occurrence are numerous. Broiler houses containing chickens are a major source of Salmonella as are most avian species, and many reptiles and insects, such as the Litter Beetle, can also serve as potential reservoirs (Bleasdale et al., 2009). Poultry farmers must take substantial measures in order to avoid contamination with their food products. Yet, despite precautionary measures by farmers, containment mechanisms are sometimes breached (Mukherjee et al., 2004). While many farmers have on-site sanitation strategies adopted from recommendations by the United States Department of Agriculture Food Safety Inspection Service, these strategies may be unfit to control every Salmonella serovar (Hong et al. 2008). In the case that a control strategy fails, it would be beneficial for the farmer to identify the specific serovar to gain a better understanding of its source and thus be aware of critical points of intervention.
Currently, most methods of serotyping are expensive and require a high degree of training to interpret and understand (Martinez et al., 2010). The most common non-molecular means of serotyping involves antibody agglutinations using a wide array of latex bead solutions coated in a variety of surface antibodies (polyclonal) specific for a given serovar — requiring both a time-consuming and expensive process. This makes molecular typing a much more viable option for many. Hong et al. (2008) developed an antigenic key based on a multiplex polymerase chain reaction (MPCR) that utilizes primers specific to the O, H1, and H2 gene sequences for antigens of Salmonella isolated from chicken broiler houses in order to serotype clinically relevant serovars which commonly occur there.
This study utilizes Hong et al.’s (2008) serotyping method to examine the type specificity of Salmonella serovars isolated from local waterways near Farmville, Virginia. Most available environmental literature focuses on the entire Genus of Salmonella without specifying serovar. This study will attempt to identify the presence of S. enterica ssp. enterica serovars Typhimurium, Enteritidis, Hadar, and Heidelberg. To accomplish this task, molecular (nuclear-acid based) characteristics are to be assessed by MPCR technology to determine or type the individual isolates of Salmonella bacteria.
Materials and Methods
Creating the Salmonella Isolate Library
Water samples were collected from three locations in Prince Edward (PE) and Cumberland Counties in Virginia: Appomattox River (APP2), Saylor’s Creek (SAY5), and Green Creek (GRE16). Each sampling location was specifically chosen as they reveal a variable, yet chronic record of high indicator bacterial presence. The samples were collected by lowering a sterile container mid-column into the stream while avoiding the uptake of autochthonous debris. Samples were then placed on ice and transported back to the laboratory for processing.
In the laboratory, the samples were assayed via membrane filtration using one milliliter (mL) of sample diluted with sterile, buffered water and filtered through a 0.45 um pore size filter membrane (Millipore, Bedford, MA). The filter membrane was transferred to a 50 mm petri plate containing 1.5 mL of tetrathionate enrichment broth (Oxoid, United Kingdom) enhanced with novobiocin (Merck, Whitehouse Station, NJ) (40 mg/L) to reduce background enteric bacterial growth and incubated at 35oC for 6-8 hours. The filter membrane was then transferred to a 50 mm petri plate containing 1.5 mL of sterile Brilliant Green Bile (BGB) broth (Remel, Lanexa, KS) and incubated an additional 24 hrs at 35oC.
At 24 hours, the plates were examined for all colony-forming units (CFU) presumed Salmonella spp. based upon colonial phenotype (i.e. color and morphology) — all presumed colonies were enumerated for the Salmonella spp. count at this time. Representative CFU’s of differing colonial phenotype were photographed and then aseptically transferred to Triple Sugar Iron (TSI) agar slants for further diagnostic testing and for later serological confirmation. TSI agar slants were incubated at 35oC for 48 hrs.
After the incubation period on TSI agar, sugar use, CO2, H2S production, and growth morphology were recorded. Aseptically obtained samples from the TSI tubes were then subjected to serologic confirmation using Oxoid Rapid Salmonella Antibody Beads™ agglutination.
Serologic confirmation by antibody agglutination was performed by mixing a loop of presumptive bacteria into the polyclonal antibody bead mixture for ten seconds on an assay card, which was tilted back and forth for an additional minute as per manufacturer’s instructions. Agglutination of the beads signified a positive test for Salmonella spp.
All bacterial isolates from TSI agar slants revealing positive agglutination were transferred to nutrient broth media to be added to the isolate library. Isolates in the library were held at room temperature and aseptically transferred to new nutrient broth media once every seven days.
Extraction of Genomic DNA (gDNA) from Isolates and Obtaining Control gDNA
An isolate was inoculated in nutrient broth media and incubated at 37oC for at least 18 hrs. Genomic DNA of the isolate was then extracted using the DNeasy Blood and Tissue Kit (Qiagen, Hilden, Germany) according to the manufacturer’s instructions. The cell lysate was then centrifuged at full speed (13,000 rpm for 5 min) to pellet the cellular debris. Two uL of the supernatant was used as a template for the MPCR modified from Jamshidi et al. (2009). Thirty-two isolates in total were processed.
Genomic DNA from 6 Salmonella spp. serovars was obtained from the Center for Food Safety, Dept. of Avian Medicine at the University of Georgia. The gDNA from serovars Mbandaka, Kentucky, Enteritidis, Typhimurium, Heidelburg, and Anatum were obtained to provide a positive control for the various antigenic formulae during the multiplex PCR process. All 6 control serovars produced the expected antigenic formulae upon PCR amplification.
MPCR Primer Design
For further confirmation that the samples were Salmonella spp., a DNA primer specific for the stn gene, which codes for the Salmonella enterotoxin, was used (see Table 1) (Makino et al. 1999). To specifically distinguish between different bacteria or groups of bacteria, researchers often look for unique differences between the genomes of the bacteria. To differentiate between serogroups of Salmonella, the DNA sequence of specific genes within each serogroup that codes for certain antigens (a foreign molecule that may invoke an immune response) is often chosen as the differentiation factor (DF). To view gene-specific differences, a variety of synthesized primers were utilized in the MPCR. This study adopted the serogroup-specific primer sequences that were used by Hong et al. (2008).
Hong et al. (2008) chose the O-antigen, part of the lipopolysaccaride (LPS) on the surface of gram-negative bacteria, H1 antigen, and H2 antigen (H antigen proteins are associated with the flagellar surfaces of bacteria) as DF’s for pathogenic Salmonella serogroupings. The genetic differences between the alleles that code for the O, H1, and H2 antigens amongst the serogroups may be exploited to differentiate them because the O, H1, and H2 antigens have several possible alleles (Joys, 1985; Samuel and Reeves, 2003). For the antigenic formulae for S. enterica serovars that were relevant to this study see Table 2. The antigenic formulae for a particular serovar consists of 3 alleles: one from each of the O-antigen, H1 antigen, and H2 antigen alleles. The O-antigen allele is expressed as a number (e.g., serovar California has an O-antigen allele of 4). The H1 and H2 antigens also have their own respective nomenclature for the various alleles such as fliC.
To develop the specific primers needed to isolate the sequence of nucleotides that code for these DF’s, the serogroup-specific wba operon (related to the O-antigen), fliC allele (related to H1 antigen), and fliB allele (related to H2 antigen) were compared amongst serogroups to identify portions of sequences that consistently differed between groups. The specific primer sequence along with its recognized antigenic allele can be seen in Table 1. Primers for this study were synthesized by Integrated DNA Technologies®, Inc. (US) and all primers present in Table 1 were utilized in this study.
Three control primers were also utilized in this study. They included: 1) The Stn enterotoxin gene targeting primer which served as a positive control for Salmonella spp. forming a band at 260 bp for Salmonella spp .— other bacterial species should not produce an amplicon when paired with the Stn primers as this gene is specific for the Genus; 2) The Universal prokaryotic 16S primer was also a positive control primer that amplifies a highly conserved region coding for the 16S ribosomal subunit. Any eubacteria should amplify a region of approximately 1500 bp when paired with the Universal 16S primers while non-eubacteria should not produce such amplicons; and, 3) The E. coli control primer was used as a negative control for PCR processing as it produces an amplicon of 585 bp for E. coli, producing no amplicon with other bacterial species. The E.coli primer was chosen as a negative control to ensure against laboratory contamination throughout any part of the serotyping process. E. coli was chosen specifically because of its shared presence in the raw water samples and because of the evolutionary relatedness of the two bacterial species.

Table 1: Forward (F) and reverse (R) primer sequences for each gene and expected amplicon size magnified by MPCR of the Salmonella isolates – Adapted from Hong et al. (2008)

Table 2: Antigenic allele formula key for S. enterica serovars identifying O alleles, H1 alleles, and H2 alleles that were relevant to this study – Adapted from Hong et al. (2008)
Mulitplex Polymerase Chain Reaction and Standard Gel Electrophoresis
While it may be possible to allelotype many of the serotypes listed in Table 2, this study focused on allelotyping the four serovars discussed in the introduction: Typhimurium, Enteritidis, Hadar, and Heidelberg. Due to logistical conflicts regarding the addition of different primers to the PCR mixture, a single reaction mixture with all of the O-antigen primers was not possible. Instead, a single isolate first underwent an array of amplifications for each allelotyping with one primer in the reaction tube. This meant, for example, that isolate 1 required a minimum of 5 reaction vessels for the O-antigen allelotyping (one reaction vessel for each O-antigen allele primer — see Table 1). The same protocol was used for the H1 antigen allelotyping and the H2 antigen allelotyping. In addition to the primers selected for the antigenic alleles, each isolate was subjected to the positive control primers (Universal 16S primer and stn primer) as well as the E. coli negative control primer to ensure PCR integrity.
Once the O-antigen allele was established, if it matched one of the four serovars for the putative O-antigen allele (see Table 1), then a second allelotyping PCR was performed using the appropriate H1 primer set. Again, if the second allelotyping matched one of the four serovars above then a third and final PCR using the H2 primer set was completed. The visualization of amplicon products after gene amplification was made via standard gel electrophoresis.
For the PCR reactions, 2 uL of extracted gDNA was utilized in the QIAGEN Multiplex PCR Kit (Qiagen, Hilden, Germany) along with the appropriate primer set, all of which were contained in a sterile 0.5 mL PCR tube (modified from Hassanein et al. 2011). The PCR kit typically contains Taq polymerase (an enzyme that anneals nucleotides to DNA strands; capable of surviving the high temperatures needed for DNA denaturation), free deoxynucleoside triphosphates (used as the building blocks of amplicons), and buffers. The enzyme, nucleotides, and buffers are collectively known as the master mix. The 0.5 mL PCR tube containing the extracted gDNA, master mix, and the appropriate primer set was placed into a thermocycler programmed to raise and lower its internal temperature over prescribed times in a series of cycles.
The changes in temperature are to promote three major steps in PCR: denaturation (strands of the gDNA disassociate from one another at high temperatures), annealing (the primers associate with the complementary strand of gDNA at lower temperatures), and extension (Taq polymerase builds the remainder of the strand containing the primer using the free nucleotides at medium temperatures). The specific PCR conditions for this experiment were 30 cycles of 94oC for 5 min, 94oC for 1 min (denaturation), 55oC for 1 min (annealing), and 72oC for 1 min (extension), 72oC for 5 min, then preserved at 4oC according to Hong et al. (2008).
Once the PCR completed, 5 uL of the (possible) product containing the amplicons had 1 uL of loading dye added in order to visualize the amplicons on the agarose gel. Six uL of amplicon product, 6 uL of 100bp marker, and 6 uL of a non-template control were loaded onto a 1.5% agarose gel submerged in 1X Tris-acetate-EDTA buffer stained with ethidium bromide and subjected to electrophoresis for 30 min at 100 volts per centimeter. The gels were then further stained with ethidium bromide (if needed) and photographed on a UV transilluminator (modified from Nashwa et al. 2009).
Results
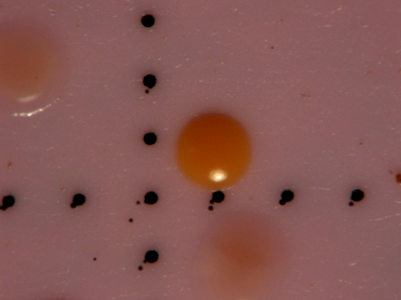
After water samples were filtered and enhanced with tetrathionate/novobiocin for Salmonella growth, the filters were transferred to plates containing BGB and incubated for 35oC for 24 hours. After 24 hours, isolates were collected based on color response and colonial phenotype. Any colony expressing a pink to orange hue was considered positive for Salmonella spp., while most yellow colonies commonly tested negative for Salmonella. All colonies considered positive for Salmonella were enumerated and recorded as the count for Salmonella for the sample date as part of another study (data not yet published). A representative colony chosen as one of the 32 isolates can be seen in Figure 1.

Figure 1. Photograph of membrane surface showing 3 colonies confirmed as positive for Salmonella
Representative presumptive colonies were aseptically transferred to TSI media to test for sugar use, CO2, and H2S production. A sample of the TSI inoculum was further tested by the antibody agglutination test to serologically confirm Salmonella spp. (Table 3). All isolates were examined for Gram staining reaction and cell morphology, of which all isolates tested as being Gram negative and rod-shaped.
It is interesting to note that while most Salmonella spp. normally produce hydrogen sulfide from thiosulfate (Midorikawa et al. 2009), 29 of the 32 environmental isolates collected did not demonstrate H2S production on TSI media. These results could be the product of an environmental selection factor unique to this area, or they could be contributed to the presence of atypical environmental variants (Table 3).
All 32 of the isolates presented a K/A response on the TSI media, which is typical for Salmonella spp. This can be interpreted as meaning that only glucose was metabolized while peptone was used as a secondary carbon source (Hajna, 1945). Additionally, all of the 32 isolates tested positive for the antibody agglutination test, serologically confirming the isolate as Salmonella spp. The antibody agglutination test contains beads layered with polyclonal antibodies for over 30 Salmonella spp. surface antigens suspended in a latex solution.

Table 3. TSI and confirmatory testing results from all isolates
Mulitplex Polymerase Chain Reaction and Gel Electrophoresis Results
The gDNA of all Salmonella was extracted and subjected to PCR magnification containing the control primers found in Table 1 for confirmation of: 1) bacterial gDNA presence, 2) Salmonella spp. presence, and 3) negative E. coli control presence. All of the bacterial samples successfully produced the expected 1500 bp amplicon when paired with the Universal 16S control primer. None of the bacterial samples except E. coli produced an amplicon when paired with the E. coli control primer.
a. An initial note on viewing electrophoretic results of PCR amplifications
A representative electrophoretic gel is presented in Figure 2. This gel, like many others in this study, compared a PCR product against a “ladder” of standardized DNA size fragments. For each antigenic allele group, a variety of primers were used to seek and magnify specific DNA sequences that could be compared to the known fragment sizes of the ladder. This study considered an isolate to possess a particular allele as long as it produced one amplicon of the expected size; although, as seen in lanes 2, 5, and 7 of Figure 2, many isolates produced multiple amplicons for a given reaction. This phenomenon could be explained due to primers reacting with other primers within the PCR process or with primers reacting with less-specific regions of DNA. Despite adjustments to optimize the PCR protocol, these extraneous bands remained to be present.

Figure 2. Photograph of a representative gel containing PCR amplicon products of the H1-1 allelotyping for the g,m allele with an expected band size of 309 bp. Left to right: lane 1 (E. coli negative control); lane 2 (Isolate 1 and g,m primer); lane 3 (Serovar Enteritidis – positive control); lane 4 (1500 bp DNA ladder); lane 5 (Isolate 2 and g,m primer); lane 6 (Isolate 11 and g,m primer); lane 7 (Isolate 13 and g,m primer); and lane 8 (Isolate 14 and g,m primer).
b. A sequence of electrophoretic gels — the logic behind Multiplex PCR allelotyping
Figures 3-5 represent the electrophoretic gel outcomes from a serotyping sequence for Isolate 3 starting with the O-antigen allelotyping results in Figure 3. If the PCR product of the isolates amplified the expected 260bp amplicon for the stn gene (present in all Salmonella spp.), then it was further subjected to O-antigen allelotyping. The band present in lane 8 of Figure 3 at approximately 397 bp represents an O-antigen allele labeled as abe2 or “8”. If, during the O-antigen allelotyping, an isolate produced an amplicon matching an expected amplicon for one of the alleles for the O-antigens, then it was further subjected to an H1 antigen allelotyping.
The results of an H1 allelotyping PCR reaction are presented in Figure 4. The band present at 363 bp in lane 1 of Figure 4 represents the appropriate size of the Salmonella H1 antigen allele labeled as fliC or “z10” listed in Table 1. The band present at approximately 294 bp in lane 2 of Figure 5 represents the appropriate size of the Salmonella H2 antigen allele labeled as fljB or “I: 1,2; 1,5; 1,6; 1,7” listed in Table 1. Antigenic formulae were compared to those listed in the World Health Organization’s 2007 “Antigenic Formulae of the Salmonella Serovars” publication for serotyping analyses (see Table 4).

Figure 3. Photograph of representative O-antigen allelotyping gel containing PCR products of the O allelotyping for the “8” allele that has an expected band size of 397bp. Left to right: lane 1 (Isolate 1 and abe2 (8) primer); lane 2 (Isolate 7 and abe2 (8) primer); lane 3 (Isolate 10 and abe2 (8) primer); lane 4 (1500bp DNA ladder); lane 5 (Isolate 14 and abe2 (8) primer); lane 6 (1500bp DNA ladder); lane 7 (Isolate 18 and abe2 (8) primer); lane 8 (Isolate 3 and abe2 (8) primer); lane 9 (Isolate 3 and the fliC (z10) primer); and lane 10 (Isolate 3 and the stn gene primer);

Figure 4. Photograph of the H1 antigen allelotyping gel containing PCR products of the H1 allelotyping for the “i” allele that has an expected band size of 508bp. Left to right: lane 1 (Isolate 3 and the fliC (z10)); lane 2 (Isolate 5 and the fliC (z10)); lane 3 (Isolate 6 and the fliC (z10)); lane 4 (1500bp DNA ladder); lane 5 (Isolate 7 and the fliC (z10)); lane 6 (Isolate 8 and the fliC (z10)).

Figure 5. Photograph of the H2 antigen allelotyping gel containing PCR products of the H2 allelotyping for the “fljB (I: 1,2; 1,5; 1,6; 1,7)” alleles that has an expected band size of 294bp. Left to right: lane 1 (Heidelberg Control and the fljB (I: 1,2; 1,5; 1,6; 1,7) primer); lane 2 (Isolate 3 and the fljB (I: 1,2; 1,5; 1,6; 1,7) primer); lane 3 (Isolate 4 and the fljB (I: 1,2; 1,5; 1,6; 1,7) primer); lane 4 (Isolate 8 and the fljB (I: 1,2; 1,5; 1,6; 1,7) primer); lane 5 (1500bp DNA ladder); lane 6 (Isolate 14 and the fljB (I: 1,2; 1,5; 1,6; 1,7) primer); lane 7 (Isolate 15 and the fljB (I: 1,2; 1,5; 1,6; 1,7) primer); lane 8 (Isolate 25 and the fljB (I: 1,2; 1,5; 1,6; 1,7) primer); lane 9 (Isolate 15 and the fljB (I: 1,2; 1,5; 1,6; 1,7) primer); lane 10 (Isolate 28 and the fljB (I: 1,2; 1,5; 1,6; 1,7) primer);

Table 4. Results from MPCR and serovar analyses. A “+” denotes that the expected amplicon was visualized via standard gel electrophoresis. A “-” denotes that no band was visualized and “*” denotes that an amplicon(s) was present other than the expected.
c. Analysis of the serotyping
Of the 24 isolates that tested positive for the stn gene, 15 isolates were typed to S. enterica subsp. enterica (or Group 1 Salmonella) and 13 isolates were able to be identified to one of the four targeted serovars: Typhimurium, Enteritidis, Hadar, or Heidelberg. As previously mentioned, Group 1 Salmonella are most closely associated with human illness.
Isolates 18, 21, 24, 26, 27, 29, and 31 amplified the stn region (e.g., were positive for being Group 1 Salmonella spp.) but did not exhibit any of the five O-antigen alleles that were tested in this study. Additionally, isolates 1, 2, 8, 13, 15, 17, and 30 did not amplify any of the H2 allele regions that were used in this study. These results may be due to the absence of the particular antigenic allele sought and/or it may be due to the isolate expressing an allele that was not tested in this study.
Many PCR products of the Salmonella isolates contained amplicons in addition to the expected singular band sizes targeted; meaning that in a single lane, multiple bands in addition to the target band would be present (isolates 1, 4, 8, 11, 13, 16, 17, 25, 28, and 30). This phenomenon could be explained due to primers reacting with other primers within the PCR process or with primers reacting with less-specific regions of DNA. Due to the sizes of the bands, it is more likely they were a result of improper primer binding during the annealing stage of the PCR process, possibly from non-optimal PCR mixtures or cycling parameters (Love et al., 1990).
Discussion
The main objective of this study was to determine whether the four most clinically relevant Salmonella spp. serovars from poultry houses could be isolated from the environmental waterways in PE and Cumberland Counties in Virginia. Table 4 shows that isolates 4, 14, 15, 17, and 32 have the potential to be either serovars Typhimurium, Kentucky, or Hadar. Due to the nature of the MPCR primer set designed by Hong et al. (2008), it is uncertain that any of the isolates are one of the clinically relevant serovars. However, it is possible that isolates 4, 14, 15, 17, and 32 are one of the four clinically relevant serovars, which means that approximately 15% of the isolates are clinically relevant serovars.
A corollary study by our lab examined the correlation between Salmonella spp. and the common water quality indicator species Escherichia coli. That study assessed the average amount of Salmonella spp. per 100mL sample and found, on average, approximately 3,800 Salmonella spp. cells in water samples from Sayler’s Creek (data not yet published). If the 15% mark is accurate, this would mean that in every 100 mL of water from Saylor’s Creek (SAY5) there could potentially be 570 Salmonella cells of clinically relevant serovars. It is important to account for the fact that isolates for this study were only gathered during cold-weather months, as isolates were not taken from warm-weather samples. Bacterial concentrations are typically lower during cold months of the year. A year-long study examining Salmonella serotypes from the local waterways would need to be completed to rule out temporal or climatic effects upon serotype presence.
This study adapted Hong et al.’s (2008) serotyping method, which was designed for typing Salmonella from commercial broiler chicken houses, to environmental water samples to gain a perspective of possible serovars that may be found in local waterways. Specific O, H1, and H2 alleles were chosen for investigation of our isolate library, with the primary focus on serotyping four major pathogenic S. entericaserovars: Typhimurium, Enteritidis, Hadar, and Heidelberg. Although this study was not able to accurately serotype any of the aforementioned serovars, we were able to place many isolates in their respective “serogroups”. As previously stated, the mostcommon pathogens for humans are found in Group 1, which is Salmonella enterica ssp. enterica (Miljković-Selimović et al. 2010).
Within Group 1 Salmonella, there are 6 major serogroups of particular clinical relevance based upon the O-antigen allele. In combination with the H1 and H2 antigen alleles, many isolates could be narrowed down to just two or three possible serovars. According to Hong et al. (2008), it is possible, with relative certainty, to consider one’s geographic location, superimposing known areas of serovar occurrence, to provide a reasonably accurate estimation of a given serovar. However, the reason that isolates in Table 4 cannot be identified to a single serovar is because for monophasic serovars, serovars only containing an H1 antigen allele (and no H2 allele), this serotyping method is less precise because it does not include all possible H2 antigen allele possibilities (Dauga et al. 1998). Therefore, it remains unclear whether an isolate is a monophasic or a biphasic serovar with an H2 antigen allele heretofore untested. The authors feel this was possibly the case with isolates: 1, 2, 8, 13, 15, 17, and 30. This problem is shown in Table 4 where an isolate is not identified to one particular serovar, but can be narrowed down to a selection of 2-5 different serovars, thus revealing the limitations of using these primers on environmental isolates of Salmonella spp.
A disparity existed between this study and Hong et al.’s (2008) study with regards to the MPCR. Initially, many attempts to “multiplex” all O-antigen primers into one reaction vessel for PCR failed to produce amplicons for any of the 32 isolates or positive controls. It is possible that miscalculation with respect to primer concentration contributed to the lack of amplification of the multiplexed primers in this study. It is unknown whether Hong et al. (2008) multiplexed the primers in this sense with success. Regardless of Hong et al.’s (2008) reasoning for classifying the PCR as multiplex, this study decided to adopt the terminology used in Hong et al.’s (2008) study.
Traditional serotyping of Salmonella spp. involves the use of over 200 non-standardized antisera that is both costly and time-consuming. Also, since there is yet a standard set of antisera, Yoshida et al. (2007) noted that researchers wishing to duplicate experimental results are limited in their data comparisons. Hong et al.’s (2008) serotyping method addresses this problem by presenting a format that could possibly be standardized and is considerably more cost effective and time-saving for definitive identification of serovar groups. By nature, PCR reactions are specific in the sense that primers recognize a given sequence of DNA, which can precisely determine serovar identity.
In Hong et al.’s (2008) experiment, this specificity is a strength considering the parameters of their setting. In broiler houses, if an outbreak of Salmonella should occur, it would most likely be contributed to a certain group of serovars associated with poultry. However, in a study such as this, using samples containing a wide assortment of unknown serovars compounded by a potentially large number of variant specimens originating from environmental samples, the specificity now becomes a handicap to the serotyping process unless many more primers for alleles may be produced (Hong et al. 2008; Zamperini et al. 2007).
The discrepancies found regarding the observed and expected hydrogen sulfide production of this study’s environmental strains should be further examined. It has been found that the phs gene within Salmonella spp. is responsible for hydrogen sulfide production (Bang et al. 2000). A study that determines the presence or absence of the phs gene in environmental isolates would be beneficial to the scientific community. Bang et al. (2000) developed a primer for the phs gene region of Salmonella spp. that could be used in a standard PCR protocol to determine whether the gene in present in a given isolate. The high percentage of our environmental isolates not producing H2S within the TSI diagnostic medium is intriguing and merits further study.
Future studies should also examine alternative methods of serotyping environmental isolates with better cost-effectiveness than the traditional antisera approach and with the greater precision of Hong et al.’s (2008) MPCR scheme. It may be worth modifying their MPCR design approach not to constellations of antigenic complexes, but to discrete antigenic alleles. For instance, the H-2 antigen primer fljB that contains markers for the 1,2; 1,5; 1,6; 1,7 alleles will produce an amplicon for any isolate that has one of those four alleles. If a primer were to be designed that would allow for distinction between the alleles 1,2 and 1,5, for example, this would eliminate the previously discussed issue of determining whether an isolate is monophasic or biphasic. By examining the genetic code of the fljB, one could create 4 separate primers to amplify each of the four fljB alleles. If specific primers were made for each allele, it would be possible to determine exactly which allele a given serovar possesses. This approach would require more time involved in serotyping analysis, but should provide a more complete antigenic formula for a given isolate and thus better precision overall.
Acknowledgements
I would like to express my sincere gratitude to the Senior Honors Research Committee for their initial and sustained support of this project throughout its completion. I would especially like to thank Dr. Mary Lehman for her role as “Faculty Liaison.” I would also like to thank the Cook-Cole College of Arts and Sciences, the Cormier Honors College, and the Department of Biological and Environmental Sciences for funding. Without their generosity this project would not have been feasible. Special recognition should also go to Dr. Dale Beach, Dr. Amorette Barber, and Mr. Dennis Jones for agreeing to seat my committee, as well as for their invaluable feedback.
Lastly, I would like to thank Dr. David Buckalew for his role as “Faculty Mentor.” Throughout the entire process, Dr. Buckalew has been there to provide insight, advice, and support and continues to do so to this day. His devotion and commitment go well above and beyond what could be expected of anyone. This thesis would not be half of what it is today if Dr. Buckalew had not spent countless hours reading and revising it, time and again. It is my genuine belief that he is the best professor, mentor, and friend that anyone could ever ask for.
Literature Cited
Bang, S., D. Clark, and J. Keasling. “Engineering hydrogen sulfide production and cadmium removal by expression of the thiosulfate reductase gene (phsABC) from Salmonella enterica serovar Typhimurium in Escherichia coli.” Appl. Environ. Microbiol. 66 (2000): 3939-3944.
Bhaduri A, S. Kalaimathy, and R. Sowdhamini. “Conservation and divergence among Salmonella enterica subspecies.” Infectious Disorders – Drug Targets 9 (2009): 248-256.
Bhowmick, P., Devegowda, D., Ruwandeepika, H., Karunasagar, I., and Karunasagar, I. “Presence of Salmonella pathogenicity island 2 genes in seafood-associated Salmonella serovars and the role of the Ssec gene in survival of Salmonella enterica serovar Weltevreden in epithelial cells.” Microbiology 157 (2012): 160-168.
Bleasdale, B., Lott, P., Jagannathan, A., Stevens, M., Birtles, R., and Wigley, P. “The Salmonella pathogenicity island 2-encoded type III secretion system is essential for the survival of Salmonella enterica Serovar Typhimurium in free-living amoebae.” Appl. Environ. Microbiol. 75 (2009): 1793-1795.
Cabral, J. “Water microbiology: bacterial pathogens and water.” International Journal Of Environmental Research And Public Health 7 (2010): 3657-3703.
Dauga, C., Zabrovskaia, A., and Grimont, P. “Restriction fragment length polymorphism analysis of some flagellin genes of Salmonella enterica.” Journal Of Clinical Microbiology 36 (1998): 2835-2843.
Dera-Tomaszewska, B. “Salmonella serovars isolated for the first time in Poland, 1995-2007.” International Journal Of Occupational Medicine & Environmental Health (Springer Science & Business Media B.V.) 25 (2012): 294-303.
Hajna, A. “Triple-sugar iron agar medium for the identification of the intestinal group of bacteria.” Journal Of Bacteriology 49 (1945): 516-517.
Hassanein R, Ali S, Abd El-Malek A, Mohamed M, and K. Elsayh. “Detection and identification of Salmonella species in minced beef and chicken meats by using multiplex PCR in Assiut City.” Veterinary World 4 (2011): 5-11.
Hong Y, Liu T, Lee M, Hofacre C, Maier M, White D, Ayers S, Wang L, Berghaus R, and J. Maurer. “Rapid screening of Salmonella enterica Serovars Enteritidis, Hadar, Heidelberg and Typhimurium using a serologically-correlative allelotyping PCR targeting the O And H antigen alleles.” BMC Microbiology 8 (2008): 178.
Jamshidi A, G A Kalidari, and M Hedayati. “Isolation and identification of Salmonella enteritidis and Salmonella Typhimurium from the eggs of retail stores in Mashhad, Iran using conventional culture method and multiplex PCR assay.” Journal Of Food Safety 30 (2010): 558-568.
Joys, T M. “The covalent structure of the phase-1 flagellar filament protein of Salmonella Typhimurium and its comparison with other flagellins.” The Journal Of Biological Chemistry 260 (1985): 15758-15761.
Lee, S, Liang, L, Juarez, S, Nanton, M, Gondwe, E, Msefula, C, Kayala, M, Necchi, F, Heath, J, Hart, P, Tsolis, R, Heyderman, R, MacLennan, C, Felgner, P, Davies, D, and McSorley, S. “Identification of a common immune signature in murine and human systemic salmonellosis.” Proceedings Of The National Academy Of Sciences Of The United States Of America 109 (2012): 4998-5003.
Love, J., Knight, A., McAleer, M., and Todd, J. “Towards construction of a high resolution map of the mouse genome using PCR-analysed microsatellites.” Nucleic Acids Research 18 (1990): 4123-4130.
Madigan, M. T, J.M. Martinko, D.A. Stahl, and D.P. Clark. Brock Biology of Microorganisms 13 (2006), p. 1036. Pearson Education, Inc. San Francisco, CA.
Makino, S., Kurazono, H., Chongsanguam, M., Hayashi, H., Cheun, H., Suzuki, S., and Shirahata, T. “Establishment of the PCR system specific to Salmonella spp. and its application for the inspection of food and fecal samples.” Journal Of Veterinary Medical Science 61 (1999): 1245-1247.
Martinez, F., Sanchez-Salazar, L., Acuna-Calvo, M., Bolanos-Acuna, H., Dittel-Dittel, I., and Campos-Chacon, E. “Microagglutination for Salmonella flagella serotyping.” Foodborne Pathogens and Disease 7 (2010): 907-911.
Midorikawa, Y., P. Newton, S. Nakamura, R. Phetsouvanh, and K. Midorikawa. “A phenomenon useful for the detection of Salmonela implementing a device from citrus extracts.” Tropical Medicine and Health 37 (2009): 115-120.
Miljković-Selimović B, T Babić, and P Stojanović. “Salmonella enterica subspecies enterica serovar Enteritidis – Actualities and importance.” Acta Medica Medianae 49 (2010): 71-75.
Mukherjee, A., Speh, D., Dyck, E., and Diez-Gonzalez, F. “Preharvest evaluation of coliforms, Escherichia coli, Salmonella, and Escherichia coli O157:H7 in organic and conventional produce grown by Minnesota farmers.” Journal Of Food Protection 67 (2004): 894-900.
Nashwa, M H, A H Mahmoud, and S A Sami. “Application of multiplex polymerase chain reaction (MPCR) for identification and characterization of Salmonella Enteritidis and Salmonella Typhimurium.” Journal Of Applied Sciences Research 5 (2009): 2343-2348.
Samuel, G and P Reeves. “Perspective/review: Biosynthesis of O-antigens: Genes and pathways involved in nucleotide sugar precursor synthesis and O-antigen assembly.” Carbohydrate Research 33 (2003): 2503-2519.
Wang, R., W. Cao, C. E. Cerniglia. “PCR detection and quantification of predominant anaerobic bacteria in human and animal fecal samples.” Appl. Envir. Microbiol. 62 (1996): 1242-1247.
Weisburg, W. G., S. M. Barns, D. A. Pelletier, and D. J. Lane. “16Sribosomal DNA amplification for phylogenetic study.” J. Bacteriol. 173 (1991):697–703.
WHO. Global Salmonella Survey, Progress Report. 2005. Accessed on Dec. 16, 2011: http://www.who.int/salmsurv/links/GSSProgressReport2005.pdf
Yingqin L, Qingke K, Curtiss I, et al. “Comparative genome analysis of the high pathogenicity Salmonella Typhimurium strain UK-1.” Plos ONE 7 (2012): 1-13.
Yoshida, C, K Franklin, P Konczy, JR McQuiston, PI Fields, JH Nash, EN Taboada, and K Rahn. “Methodologies towards the development of an oligonucleotide microarray for determination of Salmonella serotypes.” Journal Of Microbiological Methods 70 (2007): 261-271.
Zamperini, K., Soni, V., Waltman, D., Sanchez, S., Theriault, E., Bray, J., and Maurer, J. “Molecular characterization reveals Salmonella Enterica serovar 4,[5],12:I:- From poultry is a variant Typhimurium serovar.” Avian Diseases 51 (2007): 958-964.