Within RStudio we are running for linear regression with our independent and dependent variables both needing to be interval ratio. Within our regression, V23 is the involvement of the Pizza Party activity and is our dependent variable. As well as V24 is the enjoyment of the Pizza Party activity and is our independent variable. Meaning the enjoyment of the activity predicts involvement in the activity.
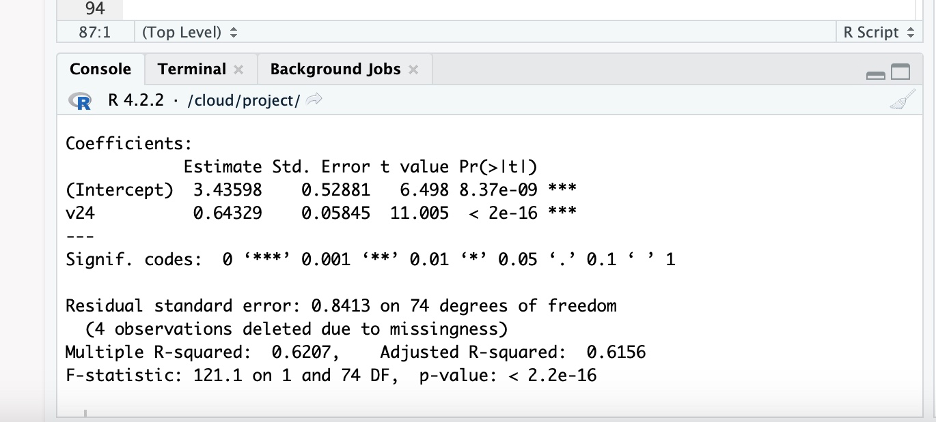
Within this regression, we hypothesize that the families who were more involved in the activity is due to having more enjoyment of the activity. Within the data with every one-unit of increase in enjoyment, involvement increased 0.64329 units. Illustrating that involvement in the activity had a positive relation to the enjoyment of the activity. These findings show that the variable is significant (p<.001). the R-squared statistic is 0.6207, meaning that this model explains 62.07 percent of the variation in the dependent variable (involvement).
These numbers 0.64329 come from the coefficient for V23xV24. Because it is positive, we can interpret that there is a positive correlation. As one variable increases, the other increases as well. For every one-unit increase in the independent variable, there is a 0.64329 increase in the dependent variable.
The p-value is comparing our alpha levels (0.05*, 0.01**,).001***) to find significance. Within the data, our P-value is <2e-16*** meaning there is significance. Our p-value is less than .001.
Lastly, our r-squared statistic shows how much variation is in our dependent and how much explains within our independent variable. In our data, our R-squared is 0.6207. Meaning our enjoyment of the activity has explained 62.07 percent of the variation in involvement R-squared=0.6207.