Here is my interpretation of what this means:
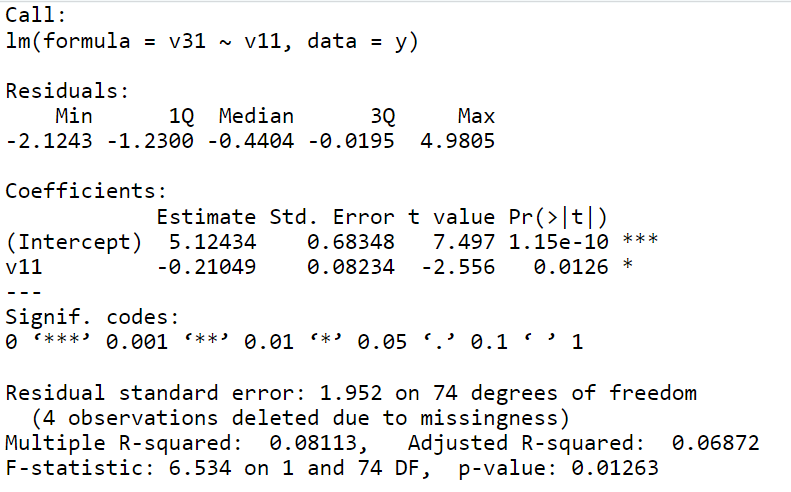
I hypothesized that families who have a better relationships would enjoy the Cupcake Flower activity more involvement. In other words, the self-ranking of the family race would influence the involvement of an activity.
The selection of the child’s race decreases by 0.2100 units for every unit increase in how much they enjoyed the Cupcake Flower Activity. Therefore, it appears that subjective race status and enjoyment of activities are inversely related. However, this finding is significant at the point 0.05 > (p = 0.013). The R2 statistic is 0.08113, meaning that this model explains 0.8 percent of the variation in the dependent variable (enjoyment of activity). No relationship can be discerned between self-ranked of a child’s race and enjoyment of the activity.

-0.21049 is the coefficient for v11xv31. Because it is negative we know there is an inverse relationship. As one increases, the other decreases.

The p-value is what you compare to our alpha levels (0.05*, 0.01**, 0.001***) to see if there is a significant difference/finding. Here there is significance at the point 0.05 > p. We do not interpret the intercept (the line above that is significant). Therefore, our p-value is 0.0126.

Lastly, our R2 statistic shows us how much of the variation in our dependent variable we have explained with our independent variable(s). In this case, our R2 is 0.08113 – BUT we must move the decimal two places to the left so we can interoperate it as a percentage and not a probability.
Example 2:
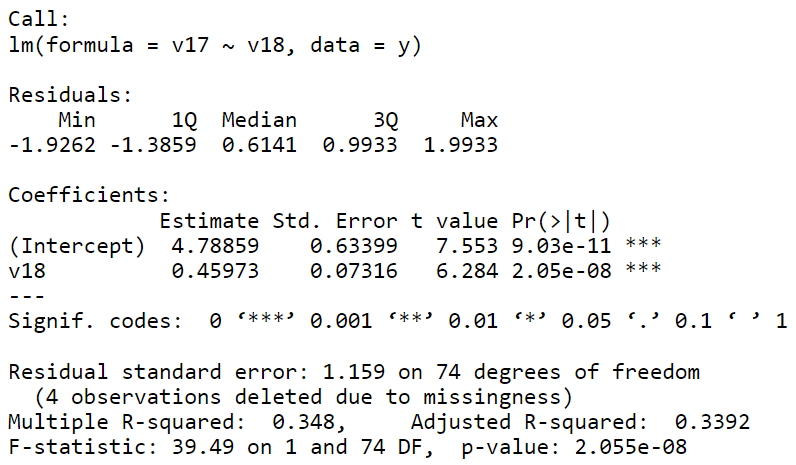
Here is my interpretation of what this means:
I hypothesized that families who have a better enjoyment of the activity would have more involvement. In other words, how much you enjoy the activities would influence your involvement in the activity.
For every one-unit increase in enjoyment, involvement increases by 0.45973 units. Therefore, it appears that involvement in the activity is positively related to enjoyment. However, this finding is not significant (p<0.001). The R2 statistic is 0.348, meaning that this model explains 34.8 percent of the variation in the dependent variable (involvement). In this case, relationships can be discerned between self-ranked family involvement and enjoyment of the activity.

0.45973 is the coefficient for v17xv18. Because it is positive we know there is a direct relationship. As one increases, the other increases.
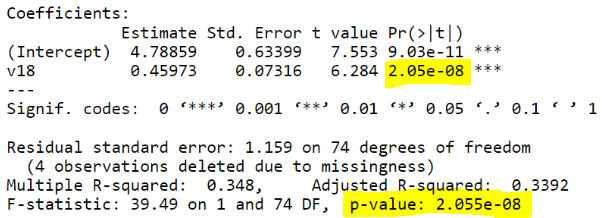
The p-value is what you compare to our alpha levels (0.05*, 0.01**, 0.001***) to see if there is a significant difference/finding. Here there is no significance. We do not interpret the intercept (the line above that is significant). Therefore, our p-value is 2.055e-08.

Lastly, our R2 statistic shows us how much of the variation in our dependent variable we have explained with our independent variable(s). In this case, our R2 is 0.348 – BUT we must move the decimal two places to the left so we can interpret it as a percentage and not a probability.