The first data set that I examined dealt with the educational levels for ages twenty five and older in the county of Chesterfield. The total amount of population in Chesterfield county is 316,236. Of that 316,236 there are 220,124 who were identified in the year 2016 for their educational attainment. Moreover, the graph determines those of which did or did not receive an educational background and how much education was received. The educational groups are identified as: less than 9th grade, 9th to 12th grade with no diploma, high school graduate (includes equivalence), some college with no degree, associate’s degree, bachelor’s degree, and graduate or professional degree. The pie chart is titled: Educational Levels for Ages 25 and Over in Chesterfield County.
Furthermore, the graph shows the levels of educational attainment reached for residents in Chesterfield County of those who are age twenty five years and older. For those who received less than a 9th grade education there were a total of 7,227 people which estimated to be about 3.30%. The people who received an education as high as 9th to 12th grade without receiving a diploma totals for 11,634 people which is estimated to be about 5.30%. Those who received a high school graduation diploma totals for 52,290 people which estimated to be about 23.80%. The people who identified as having some college with no degree total for roughly 48,091 people which estimated to be about 21.80%. Those people who are accounted for obtaining an associate’s degree in the county of Chesterfield is about 17,918 people which is estimated to be about 8.10% of the overall population. Those who have a bachelor’s degree are a total of 51,287 people which is estimated to be 23.3%. Lastly, those who received a graduate or professional degree total to 31,677 people with an estimated 14.4% of the total population.
I chose to do a pie chart because of the ability to see the total of the population in one easy chart. This chart gives access to the total amount and the percentage; moreover, the chart shows how much of an impact each different educational level has in reference to the total community of ages twenty five and older in Chesterfield County. Educational levels are portrayed in the chart and shown with different colors to help identify each level. My reasoning for doing colors that were much different from one another is it make the chart easier to read and the educational levels identifiable from afar. Furthermore, I choose the region of Chesterfield County because this is were I live and have lived all my life. I found the data and statistics to be very interesting. The data shows that the highest level of educational attainment is high school graduate at 23.8% of the total population; however, those people with bachelor’s degree is at a percentage of 23.3 of the total population. The difference between the two is .5% which is not an extremely large amount. This data was very interesting to view and make into a chart to see the visual representation of the different educational attainment through groups ages twenty five and above.
https://factfinder.census.gov/faces/tableservices/jsf/pages/productview.xhtml?src=C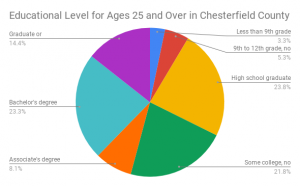
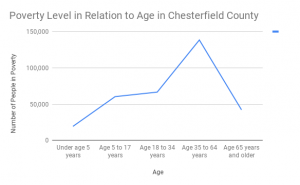
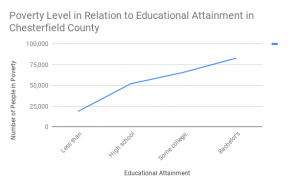
The next graph that I examined had to deal with poverty levels for the population of Chesterfield County throughout all ages of the general population. Moreover, the poverty level was identified within the ranges of: under age of five, age 5 to 17 years, age 18 to 34 years, age 35 to 64 years, and age 65 years and older. For this data set I compared two different sets of data to analyze the correlation between age and educational attainment in reference to poverty levels. I gathered information from both sets of data to see the connection, if any, between age and educational levels. The educational attainment categories were as follows: less than high school graduate, high school graduate, some college / associate’s degree, and bachelor’s degree and higher. Two line graphs were created to examine and analyze the data sets. The first set of data being examined about age in poverty and the second being about educational attainment in poverty.
Furthermore, the graph identifies that in Chesterfield County ages five and under there is a total of 19,361 total children who fall in the poverty level. For ages 5 to 17 years the total number of people who fall under poverty is 60,360 people. Those who are aged 18 to 34 years old account for 66,589 people who fall under the poverty level in Chesterfield County. For ages 35 to to 64 years old the amount of people who fall under the poverty level account for 138,435 people. Lastly, for ages 65 years and older the population of those who fall under poverty is 42,219 people. The other graph that I created looked at the poverty levels for educational attainment. Those results included people with less than a high school degree which accounted for 18,586 people. High school graduates included in the poverty level account for 51,999 people. Those with some college or associate’s degree include 65,762 people. Those people with a bachelor’s degree or higher account for 82,927 people in Chesterfield County.
The information I gathered between the two graphs is very interesting to see the results of the data analyzed. I choose to continue to do Chesterfield County because it is where I live and the results were interesting to compare to each graph that was conducted. I did the line graph for this particular data to show the correlation between age and poverty and educational attainment and poverty. The line graph shows the relationship between the two situations and how they correlate to one another.
https://factfinder.census.gov/faces/tableservices/jsf/pages/productview.xhtml?src=CF