Abstract
With the FDA mandating that all foodstuff labels list the amount of trans fats within their product, it becomes necessary to have a rapid and reproducible method for quantifying trans content within foods. Research has led to the advent of an analytical method that utilizes attenuated total reflectance with a Fourier transform infrared spectrometer to quantitatively measure trans fat in foodstuffs. The method is possible because of an infrared absorbance band at 966 cm-1 that is unique to nutritional trans fats. This research used the aforementioned method to quantify trans fat content in common cooking vegetable oils. Before analysis, the oil samples were heated to different temperatures that were less than or equal their respective smoke point. Results from all heated oil samples provided data that was below the calibration range (0.5 – 40% trans fat).
Introduction
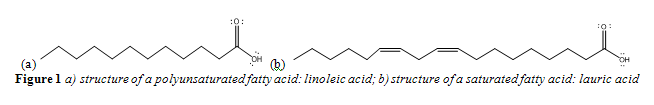
In order to improve taste, shelf-life, and cooking quality at a low cost, the food industry has long been in the practice of converting vegetable oils into margarines and shortenings, via a hydrogenation process, that are to be used primarily in most packaged foodstuffs.1 Fatty acids, the main constituents of vegetable oils, are a carboxylic group attached to a long hydrocarbon tail of varying length.1 Saturated fatty acids have no double bonds in the tail while mono- and polyunsaturated fatty acids have one or many respectively.1 A saturated and a polyunsaturated fat are shown in Figure 1a-b. The linear geometry of saturated fats allows them to compact and be in a solid state at room temperature. The bent geometry of unsaturated fats inhibits compaction and makes them liquid state at room temperature.1
During hydrogenation, the double bonds present in the polyunsaturated and monounsaturated fatty acids are converted to saturated fatty acids.1,2 It is a simple process that consists of mixing heated vegetable oil with hydrogen gas in the presence of a catalyst.1 Flavor stability and longevity is achieved with hydrogenation because, in reducing the amount of double bonds, the process limits possible sites for oxidation.1 Complete hydrogenation requires ample energy input through catalyst concentration and pressure and does not always provide the desired functional characteristics in the oil product.3
In order to elicit the desired characteristics from hydrogenated oil, the food industry implements a selective hydrogenation process.1,2,4 The process is selective in that the catalyst used hydrogenates fats with the highest degree of unsaturation first (poly-) before hydrogenating di- or monounsaturated fats.1 This allows more control over the level of hydrogenation within the oil product.1 The vegetable oils are modulated by temperature, pressure, agitation, and catalyst concentration during hydrogenation to keep desired quantities of unsaturated fats in the final product. The remaining unsaturated fats give the hydrogenated oil a better liquid to solid fat ratio and therein, better functionality.1
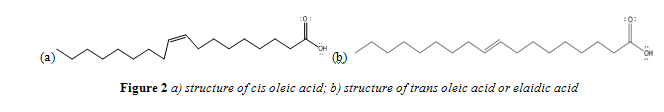
During hydrogenation, the natural cis-geometry carbon-carbon double bonds of the unsaturated fatty acids in vegetable oils are broken.5 The freed electron density goes toward adding hydrogen to both the carbons that had previously been double bonded.3 This process, like any other reaction, is expedited with heat and is rapidly facilitated by a two-step nickel catalyst.2,3 However, in partial hydrogenation, where there are unsaturated fats that remain throughout hydrogenation, the double bond can break from the heat or an incomplete interaction with the catalyst and subsequently reform.3 When reformation occurs, the trans geometry of the double bond is strongly favored over the natural cis for both thermodynamic and steric reasons.3 The resulting fatty acid by-product is then termed a trans fat.1,2,3 Since trans fats are linear in geometry, like a saturated fat, they increase the solid ratio of the hydrogenated oil. A comparison of a cis and trans fat is shown in Figure 2 a-b. Margarine and shortening stocks produced commercially from vegetable oils can have trans fat concentration as high as 40%.2
The formation of trans fatty acids during the production of partially hydrogenated oils in the food industry is a negative consequence due to the adverse health effects that have been attributed to dietary trans fats.2,5,6,7 In particular, initial research showed that increases of dietary trans fats gave rise to significantly higher risks of coronary heart disease (CHD) in humans. 2,5,6,7 More clinical research and trials followed to investigate why trans fats contribute to CHD, and subsequently atherosclerosis.2
Human digestive enzymes that specialize in the uptake, transport, and degradation of fatty acids are shape-specific to the natural, cis double bond formation.5 Without uptake or degradation, an ingested trans fat will not have the metabolic or structural potential of the original fatty acid.5 Furthermore, trans fats mimic the shape of a saturated fat.5 Body cells can attempt to incorporate trans fats into structures, like membrane phospholipids, resulting in a deficiency of said structure to perform its desired task.5
With respect to CHD, trans fats show their most adverse effect on the levels of blood lipid carrier molecules: low-density lipoprotein (LDL) cholesterol and high-density lipoprotein (HDL) cholesterol.5,6,7,8 Both molecules are measured by the ratio of their respective concentration in the blood.5 A high percentage of LDL (the unhealthy lipid cholesterol) in comparison to HDL (the healthy lipid cholesterol) has long been the standard indicator for both CHD and an elevated risk for atherosclerosis.5 Saturated fats, which are also considered unhealthy, raise LDL levels but leave HDL levels constant.5 Trans fats however, not only increase the amount of LDL but decrease the amount of HDL in the blood, leaving a cholesterol ratio that is far worse than what saturated fats produce.5,8 Such malevolent health effects found in epidemiological and cellular studies brought trans fat to the attention of the public, food suppliers, and government regulation agencies.4
The United States’ Food and Drug Administration (FDA) has the responsibility to guarantee that products intended for human ingestion are safe for consumption.4 The jurisdiction of the FDA is outlined primarily in the Fair Packaging and Labeling Act and Federal Food, Drug, and Cosmetic Act (FFDCA); both of which provide the federal laws necessary to inspect and regulate the safety of almost all U.S. foodstuffs.4 In 1990, the Nutrition Labeling and Education Act sought to expand the required nutritional elements, previously listed in the FFDCA, that are required to be present on the labels of all foods and supplements. However, when the FDA implemented its final rule in 1993 and turned the act into law, trans fats were not included in the amended list of required nutrients for labeling purposes.4 At the time, the FDA considered research on the health implications of trans fats to be incomplete, making it premature to require the amount of trans present to be listed on a label.4
In light of more and more research that corroborated the findings outlined above concerning the negative health effects of trans fats, the FDA was forced to revisit the issue of trans fat labeling.4 Expert panels were convinced by the scientific evidence and were strongly suggesting that the American consumption of trans fats should be limited.4 Their recommendation, in parallel with old recommendations concerning saturated fats, was that consumers should purchase foods that had low, if any, trans fat content.4 The FDA conceded to both the experts and a growing public outcry in 1999. In 2003, a final rule passed which mandated that the trans fat content of all foods and supplements be listed, starting in 2006.9 As dictated in the final rule, companies are obligated to list the exact trans fat content, unless it is less than 0.5 g / serving size in which case trans content can be labeled as zero .9
With the labeling of trans fat content mandatory, it became necessary for regulators and manufacturers to have a simple, rapid, and reproducible method for assessing trans content in foodstuffs.2,10-13 As food manufacturers attempt to reduce and limit the amount of trans fat in their product, the analytical method employed must also be particularly sensitive to quantify lower concentrations (e.x % trans < 5% trans fat) in order to ensure label accuracy.4,10-14
A capillary gas chromatography (GC) method was initially used to quantify trans fat in food samples.4,10-14 An official GC method was approved and released by the Association of Official Analytical Chemists (AOAC).4 Accurate and reproducible determination of trans fat content and identification of each specific trans fatty acid present are both very possible with the GC method.4,10-13 However, GC has limitations in its use for regulatory purposes.
The use of a long (100 m) capillary column coated with a highly polar stationary phase is required to achieve the needed separation of every fatty acid.4 Sufficient separations can take as long as 1.5 hours for a single analysis.4,10,11 Therefore, despite its reliable accuracy and detailed information on fat content, the time involved with sample preparation and analysis makes the GC method inefficient for the quick and repetitive determination of trans fats needed for labeling and regulatory oversight.4,10,11
Another technique has been tested and implemented for rapid determination of trans fats: infrared spectroscopy (IR).4,10-14 The IR method relies on the spectroscopic properties of trans fatty acids, particularly a CH out-of-plane deformation band seen at 966 cm-1 that represents an isolated trans double bond absorption.4 This is particularly useful because the band is unique to the specific trans double bond that the FDA uses to define a nutritional trans fat: an unsaturated fatty acid that has one or more non-conjugated, trans double bonds.4,9 Fatty acids that posses conjugated trans bonds have been shown in research to not have the adverse health effects of isolated trans bonds.15 In fact, some actually exert positive health benefits.15,16
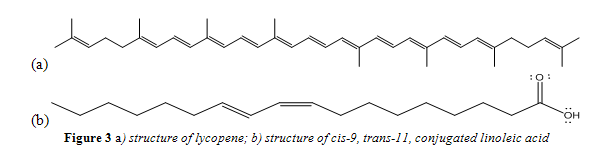
Conjugated double bonds that are found naturally in unsaturated fatty acids and other molecules have absorption bands that are shifted to 985 – 990 cm-1 and to 940 – 950 cm-1.12 Therefore, if a food sample contained heavily conjugated molecules, such as lycopene shown in Figure 3a, or a conjugated fatty acid, like conjugated linoleic acid shown in Figure 3b, absorption from the conjugated trans bonds would not interfere with the trans absorbance at 966 cm-1. This spectrometric characteristic makes the 966 cm-1 band exclusive to nutritional trans fatty acids.4,10-14
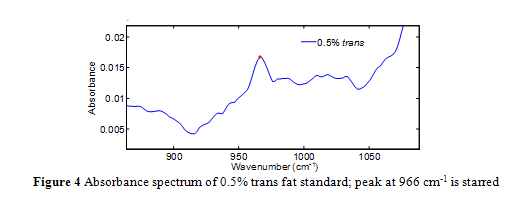
Quantification is achieved by standards and a calibration curve constructed from the area under the 966 cm-1 band. Integration is used, as opposed to the individual absorbance value at 966 cm-1, in order to fully encompass the infrared absorption intensity.4,12,13 Unfortunately, the absorption at 966 cm-1 occurs over an elevated and sloping baseline, as seen in Figure 4, which gives rise to inaccuracies in quantification via integration, particularly as trans concentration gets smaller.4,10-14
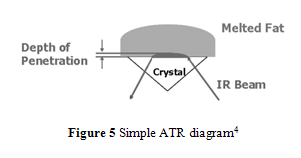
In order to achieve better accuracy and resolution, internal reflection methods are used for infrared absorption analysis.4,10-14 In particular, attenuated total reflection (ATR) has been commonly implemented because of its ability to analyze a sample that has not been specially prepared or a total lipid extract sample.4 During ATR analysis, infrared radiation barely penetrates (only a few µm) the fat or oil sample that rests above an internal reflection crystal.4,10 As IR light oscillates, undergoing internal reflections, within the crystal, small amounts of radiation penetrates the sample.4,10 The radiation intensity quickly decays, thus changing the wave’s frequency which can be used to measure the depth the wave penetrated.4,10 Using radiation angles, penetration depth, and Fourier transform, the attenuation of IR within the sample can be calculated and used to form a spectrum that has greater accuracy and better resolution than conventional IR spectroscopy.4,10 An ATR diagram is shown in Figure 5.

Spectra from a trans free reference oil, ideally of similar fatty acid structure, are used as a background to compare with a trans present sample.4,10 The official AOAC method for analyzing trans fats using IR methods recommends ATR with Fourier transform infrared spectroscopy (ATR-FTIR).4,10-14,14
The addition of ATR and Fourier transform in the official method did eliminate the baseline offset and slope, yet its accuracy at lower concentrations ( less than 5%) was only slightly improved.4,10 The remaining inaccuracy was attributed to the inability to find a reference fat that is absolutely trans free and has a composition that closely matches every test sample.4,11,12,13 Also, saturated fatty acids were concluded to be causing absorbance interference in the spectra of samples with low trans content.4,12,13
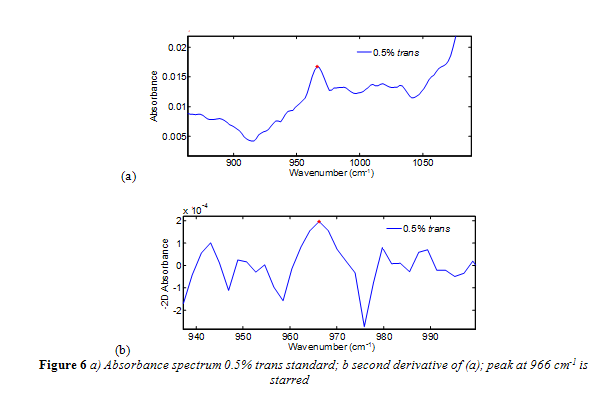
Nevertheless, further research on the ATR-FTIR method has led to improvements that have increased its accuracy and sensitivity.4, 12,13 In specific, a negative second derivative method (-2D) has been implemented successfully and is now nearing the end of a validation process by the AOAC.4,12,13 The second derivative has commonly been used to enhance spectral resolution, particularly with Fourier spectra.4,12,13 The negative in the method’s name simply means the spectra are multiplied by -1 to have the second derivative absorption peak face up for convenience. Even when trans fat standards were analyzed relative to air, as opposed to a reference oil, the -2D method eliminated the sloping baseline, and clearly resolved bands from interfering fats away from the 966 cm-1 band.4,12,13An absorbance spectrum compared to a second derivative absorbance spectrum is shown in Figure 6a-b. As shown in Figure 6b, the starting and finishing points of the 966 cm-1 band is clearly defined. The precision of the -2D method is considered to be 0.5% trans fat as a percentage of total fat.2,15
As indicated by the FDA mandating that trans fat content be listed on the label of all foods and supplements, there is considerable public concern relating to trans-fats.17 Consumers are increasingly more likely to buy products that contain natural polyunsaturated fats, which have been correlated to a lesser risk of coronary heart disease.17,18 An example of this shift is seen in the purchasing of oiled cooking products.17 People are now more inclined to cook with a vegetable oil medium, to avoid the saturated fats of butter or margarine and to have the health benefits from the oil’s polyunsaturated fats.17 However, the health benefits of the vegetable oil would perhaps be reduced if the heat and duration of cooking induces cis-unsaturated fats to isomerize to trans, much like it does in hydrogenation and vegetable oil deodorization processes.1,19
This research investigated the effects of heating common cooking oils on their trans fat content. Furthermore, oleic acid, which is the greatest monounsaturated fat constituent in canola oil, was also studied in this manner. The hypothesis was that the isomerization of cis oleic acid to trans oleic acid could be easily analyzed and could conceptually represent what was occurring in the cooking oils. Each oil was heated to a series of designated temperatures below, equal to, or slightly above its respective smoke point. The smoke point is the temperature at which the fatty oil starts produce smoke from internal hydrolysis and oxidation.1 This temperature is a common indicator of when a fatty oil begins to degrade and lose culinary functionality (like taste).1 At each temperature, aliquots of each oil were removed at designated times for ATR-FTIR testing. The -2D method was employed to achieve the greatest accuracy in quantifying total trans fat concentration in the oils. For the purposes of comparing methods, a fatty acid rich cooking medium was analyzed qualitatively via GC-MS. The results from which greatly emphasized the advantages of ATR-FTIR.
Experimental
ATR-FTIR Method
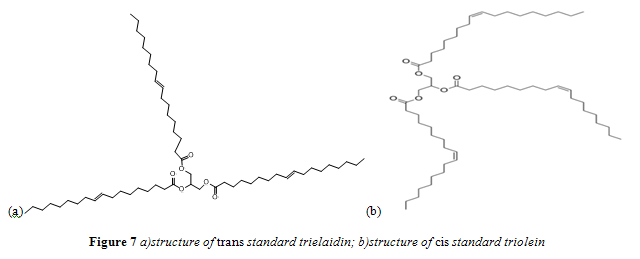
In accordance with past research that quantified trans fat content, standards were prepared using trielaidin (2,3-bis[[(E)-octadec-9-enoyl]oxy]propyl (E)-octadec-9-enoate) as a pure trans fatty acid and triolein (2,3-Bis[[(Z)-octadec-9-enoyl]oxy]propyl (Z)-octadec-9-enoate) as a pure cis fatty acid standard.11,12 Specifically, Nu-Chek Prep trielaidin and MP Biomedicals triolein were used. These fatty acids are identical, except for the geometry of their carbon-carbon double bond. Structures for trielaidin and triolein are shown in Figures 7a and 7b respectively. Standard concentrations ranged from 0.5 – 40% trans/cis fat w/w.
The specific oils used in this experiment were Fisher® reagent grade pure oleic acid, Great Value® (GV) pure corn oil, GV pure canola oil, GV pure olive oil, and Filippo Berio® olive oil. Except for oleic acid, all oils were purchased at Wal-Mart® which sells Great Value® products as the generic brand. Therefore, the GV pure olive oil was considered the generic brand and Filippo Berio® olive oil the name, or premium brand.
For each heated sample, moderately sized aliquots of the cooking oils were put in a beaker and heated with a Corning PC-420D hot plate. A stir bar was added to each sample to ensure temperature uniformity throughout the oil. Fisher® thermometers, held on a clamp, were used to monitor temperature.
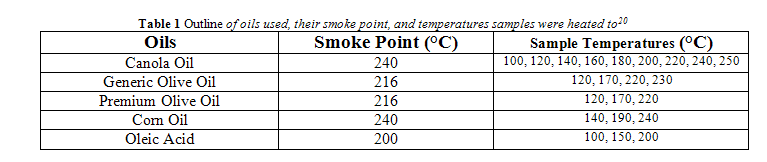
The smoke point of all oils tested is listed in Table 1. For all oils, except canola oil, samples were brought to the smoke point, 50 °C below the smoke point, and 100 °C below the smoke point. Canola oil samples were heated to temperatures starting at 100 °C and going to 240 °C (the smoke point) by 20 °C increments. An additional measurement for canola oil and generic olive oil was taken where an oil sample was heated to 10 °C above the smoke point. The exact temperatures used for each oil is outlined in Table 1.
In order to assess production of trans fats at a given temperature over the course of time, small aliquots were removed at different time intervals from each heated sample. Initially, said intervals were 1, 3, 5, 10, and 15 minutes. However, the intervals were modified to 1, 5, and 12 minutes, to save time and materials.
All standards and samples were analyzed using a Thermo Nicolet Avatar 360 FT-IR with Smart MIRacle. The ATR apparatus had a zinc selenide crystal. In accordance to past research, 256 scans were taken per analysis with a resolution of 4 cm-1.4,10-14
Absorbance spectra were taken from the FTIR and uploaded into the data analysis program, MatLab® 7.9.0 (R2009b). Matlab did not have pre-written functions to take a second derivative or area under a spectrum curve. A function was written to take both the negative second derivative of all spectra and the area under the 966 cm-1. Peak area was estimated using the trapezoid rule, shown in Figure 8 where ‘S(X)’ represents the spectral output at any given wavenumber (X), and X0 and Xn represent the starting and final wavenumbers for integration.
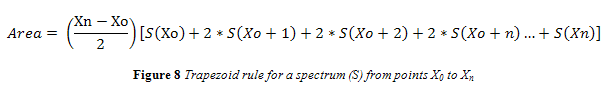 The area for the 966 cm-1 band was taken from wavenumbers 955 – 974 cm-1. This range is smaller than what was used in past research.4,12,13 However, the range used encompassed the entire trans band of even 40% trans standards and still provided a sufficient number of data points for integration via trapezoid rule.
Gas Chromatography-Mass Spectrometry (GC-MS) Method
The cooking medium to be assessed qualitatively was Crisco® All-Vegetable Shortening because it closely matched the shortening used in past research with GC-MS.21 In order to be compatible for chromatography, the shortening had to be prepped with a lipid extraction and a transesterfication to convert the fatty acids to methyl esters for volatility.4,21 In accordance with previous research, a 100 mg sample of shortening was dissolved in 25 ml of hexane.21 Roughly 5 ml of the mixture solution was added to 250 µl of 0.5 M sodium methoxide/methanol solution and vortexed. A 5 ml aliquot of saturated NaCl solution was added. The container was shaken vigorously and allowed to settle before transferring 3 ml of the hexane layer to another vial to be mixed with sodium sulfate to remove any residual water before GC analysis.
A Varian 3900 GC oven and Varian 2000 GC-MS were used for analysis. A FactorFourTM VF-1ms capillary column (30 m x 0.25 mm, 0.25 μm film thickness) was used out of convenience because it was already connected within the oven. Again, in accordance with past research using GC-MS, the injection volume was 1 µl, injection temperature was 250 ºC, and the injection split ratio was 100.21 The best fatty acid methyl ester separation seen in previous research utilized the following temperature programming: initial temperature 150 ºC, hold 10 minutes, ramp at 2.7 ºC/min, final temperature 210 ºC, hold for 3 minutes.21
Results and Discussion
ATR-FTIR Results
Calibration Curve
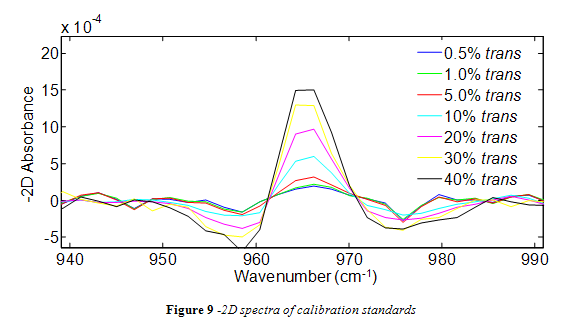
Spectra from the trans standards were successfully analyzed in Matlab using the -2D method. As shown in Figure 9, the trans peak of -2D spectra maintained a consistent shape with all standards and increased in height as the percent trans increased. However, as seen in Figure 9, some of the -2D absorbance data points in the integration range (955 – 974 cm-1) were negative. In order to avoid using negative data points for integration, the spectra over the integration range was offset so that the lowest point became zero. For consistency, all subsequent spectra from oil samples were offset in the same way.
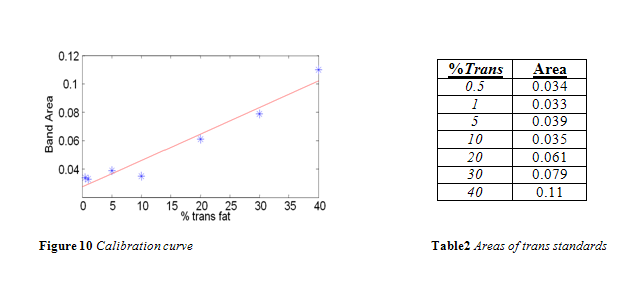
The area of the 966 cm-1 band for each standard is listed in Table 2. A calibration curve was composed from this data, as shown in Figure 10. In accordance with the literature, a positive linear correlation was seen between area and % trans fat that had a correlation coefficient of 0.9499. 4,10-13
Vegetable Oil Samples
Canola Oil
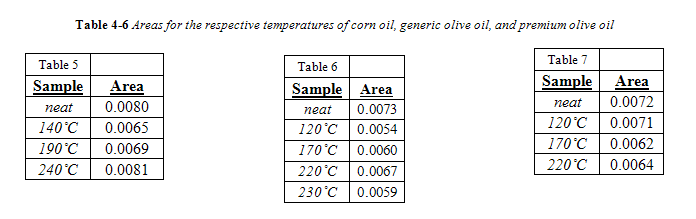
The complete area values for all canola samples are listed in Table 3. Regardless of temperature or duration, all areas of the 966 cm-1 band were below the calibration range, meaning their band area was below 0.034. Therefore, the trans concentration is below 0.5%. As seen in Table 3, there was no correlation between area of the trans band with duration of heating for a given temperature. For convenience, all area values for a given temperature were averaged together and are listed in Table 4 in comparison to the trans band area of “neat,” or unheated, canola oil.

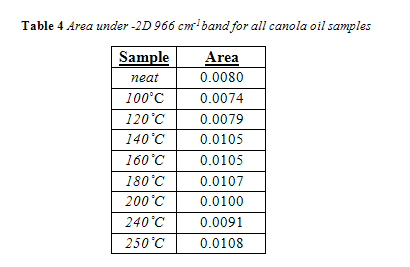
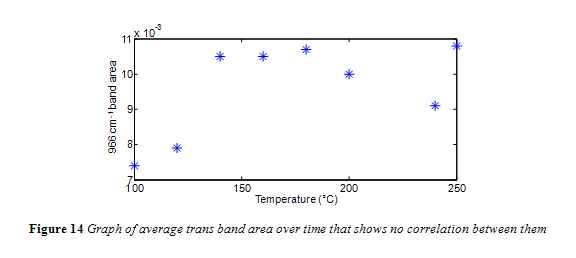
Interesting to note, the neat canola oil had a larger trans band area than samples heated at 100 °C and 120 °C. This is misleading, considering how the shape of the trans band, particularly its width, changed with temperature, as seen in Figure 11. The change in trans band shape can be attributed to interference from other fatty acids, particularly saturated fatty acids.13 This is in accordance with past research which noted that noted that trans levels below 0.5% were subject to shifting because the trans absorbance at those concentrations is too feeble to outcompete interference from saturated fats.4,13 Yet, as seen in Figure 12 and 13, the trans band started to have a more consistent shape and got more prominent with increasing temperature. Differences in area, however, were minimal. As seen in Figure 14, there was no correlation between temperature and the 966 cm-1 band area within the experiments time range.

Corn Oil, Generic and Premium Olive Oil
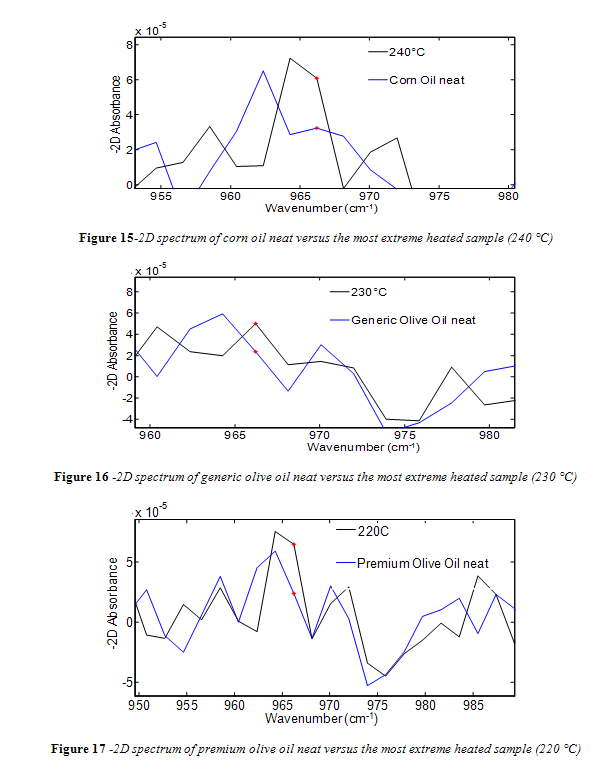
 Unlike canola oil, spectra of unheated neat samples from the remaining vegetable oils showed no initial trans band, shown in Figures 15-17. Spectra shape shifted with increasing temperature in the same way as canola oil for the remaining oils. Nevertheless, temperatures near the smoke point produced spectra that had an easily identifiable trans band, also shown in Figures 15-17.
Oleic Acid
Spectra from oleic acid samples, seen in Figure 18, showed a trans band that was clearly defined and easily distinguishable, much like spectra from the calibration standards. This is due to the fact that there were no saturated fatty acids in the samples to interfere with trans absorption.
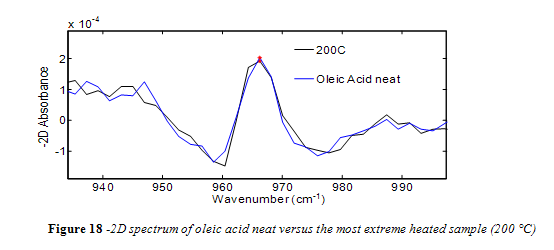
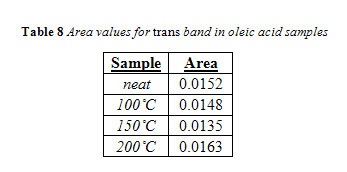
Nevertheless, band areas fluctuated slightly within a given temperature and no correlation was seen between area and increasing time. Once again, the areas for all samples within a given temperature were averaged together and are listed below in Tables 8 in comparison to the trans band area of the neat oleic acid. Area of the trans band in 100°C and 150°C samples were less than the area of neat oleic acid, while the area of the 200°C was slightly larger than neat oleic acid. However, this is indicative of very little, considering how identical the spectra of neat oleic acid and the 200°C sample are, as seen in Figure 18. Differences in area can thus be attributed to minor fluctuations in band shape that occur inherently within analyzing multiple samples.
GC-MS Results
The GC-MS method used here did not elicit the desired chromatogram.4,10,14,19 Instead of a clearly isolated peak for every individual fatty acid, the peaks overlapped and had long tails as they eluted, as seen in Figure 19. The sample that was injected was perhaps too concentrated and the peak splitting observed in Figure 19 could then be attributed to column overload. Furthermore, the all purpose VF-1ms column used was not prepped before analysis. The first two feet of the column were not cut off to prevent contamination and, because of this omitted caution, such possible contamination could have also contributed to the poor chromatogram results.
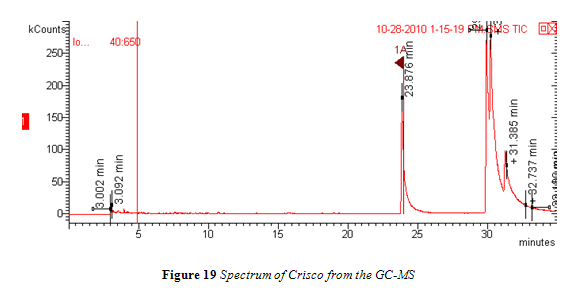
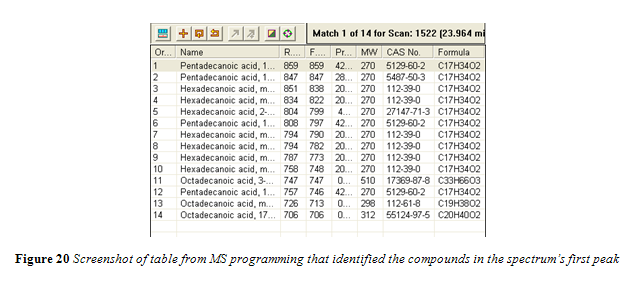
All peaks in the chromatogram were identified by the mass spectrum to be fatty acid methyl esters. The first large peak, starting at around 24 minutes, was flagged and the identification data from the MS is shown in Figure 20.
 Nevertheless, the results from the GC-MS further emphasize the advantages of ATR-FTIR over GC when it comes to analyzing trans fat content. The ATR-FTIR, without any special modification, was able to assess trans content from standards and oil samples, that required no preparation, in about 5 minutes per analysis. With the GC-MS, each sample took between 30 and 35 min to pass through the column. Every sample for analysis had to be extracted and converted to methyl esters before it could be used in the GC. Furthermore, for a desirable spectrum to be obtained, the proper column would have to be purchased and properly installed in the GC oven. The above limitations of the GC-MS alone, without further complications from analyzing quantitatively, would have made it a very cumbersome, time consuming, and expensive method use in order to analyze the trans fat content in the vegetable oil samples of this experiment.
Conclusion
The negative second derivative method successfully resolved the infrared trans absorption band at 966 cm-1 for all trans standards. A functional calibration curve was constructed using the area of the -2D trans band from each trans standard. However, the area of the trans bands for all samples of heated vegetable oil and heated oleic acid were below the calibration range (0.5 – 40% trans fat). Furthermore, the trans peak from heated oil samples was not strong enough to overcome interferences created by saturated fat absorptions. This led to fluctuating baselines and inconsistent shapes for the trans band. Despite the above, a qualitative analysis using GC-MS emphasized the GC method’s limitations and ATR-FTIR method’s advantages for multiple and rapid determination of trans fat content.
The results indicate that heating canola, corn, and premium and generic olive oil to their smoke point for at least 15 minutes does not quantifiably increase their respective concentration of trans fatty acids. Those who are inclined to cook with a vegetable oil medium, to avoid the saturated fats of butter or margarine and to have the health benefits from the oil’s polyunsaturated fats, now have further justification for their choice of cooking medium.
Results could have been improved by using a data analysis program that was equipped with a pre-existing and more accurate integration function. The trapezoid rule, while reliable, is nonetheless an approximation method for integration. Future work could also include heating oil samples to higher temperatures and for longer durations to assess when significant quantities of heat induced cis/trans isomerization does occur. Results from this would perhaps not be as relevant to human health or cooking but would provide interesting data.
Acknowledgements
I would like to acknowledge those who have made it possible for me to conduct this research project. I would especially like to thank Dr. Sara Porter for her guidance and oversight. I would also like to thank Dr. Porter for her significant investment in this research and her expectation that I never settle and that I always push further. Also, I would like to thank the Longwood University Department of Chemistry and Physics for funding, research space, and professors who are more than happy to satisfy my curiosity. Furthermore, I would like to thank the Cormier Honors College for their financial support and enabling me to present at the 240th American Chemical Society National Meeting held in Anaheim in March 2011. Finally, I would like to thank my father and brother, Porter and Thomas Scott, for their wisdom, guidance, and encouragement to fully develop my potential.
References
1. O’Brian, R.K.; 2009 Fats and oils: formulating and processing for applications. CRC Press, Boca Raton, FL.
2. Eller, F.J., List, G.R., Teel, J.A., Steidley, K.R., Adlof, R.O.; Preparation of Spread Oils Meeting U.S. Food and Drug Administration Labeling Requirements for Trans Fatty Acids via Pressure-Controlled Hydrogenation. J. Agric. Food Chem. 2005, 53, 5982-5984
3. Hsu, N., Diosady, L.L., Rubin, L. J.; Catalytic behavior of palladium in the hydrogenation of edible oils II. Geometrical and positional isomerization characteristics. JOAC., 1998, 66 (2), 232-236.
4. Mossoba, M.M., Moss, J., Kramer, J.K. Trans fat labeling and levels in U.S. foods: assessment of gas chromatographic and infrared spectroscopic techniques for regulatory compliance. Journal Of AOAC International 2009, 92, pp. 1284-1300.
5. Ascherio, A., Willett, W.C.; Health effects of trans fatty acids. Am J Clin Nutr. 1997, 66, 1006S-lOS.
6. Booker, C., Mann J. Trans fatty acids and cardiovascular health: translation of the evidence base. Nutrition, Metabolism, And Cardiovascular Diseases: NMCD 2008, 18, pp.448-456.
7. Hunter, J.E.; Dietary levels of trans-fatty acids: basis for health concerns and industry effort to limit use. Nutrition Research. 2005, 25, 499-513.
8. Mozaffarian, D.,Clarke, R.; Quantitative effects on cardiovascular risk factors and coronary heart disease risk of replacing partially hydrogenated vegetable oils with other fats and oils. European Journal of Clinical Nutrition 2009, 63, S22–S33.
9. Food and Drug Admistration, HHS; Food labeling: trans fatty acids in nutrition labeling, nutrient content claims, and health claims. Final rule. Federal Register 2003; 68, pp. 41433-41506.
10. Mossoba, M.M., Kramer, J.K.G., Delmonte, P., Yurawecz, M.P., Rader, J.I.; 2005 In: Kodali, D.R, List, G.R., (eds) Trans Fat Alternatives. AOCS Press, Champaig, IL, 47-70.
11. Mossoba, M. M., Milosevic, V., Milosevic, M., Kramer J. K. G., Azizian H. Determination of total trans fats and oils by infrared spectroscopy for regulatory compliance. Analytical And Bioanalytical Chemistry 2007, 389, 87-92.
12. Mossoba, M. M., Milosevic, V., Milosevic, M., Kramer J. K. G., Azizian H. Determining low levels of trans fatty acids in foods using improved ATR-FTIR procedure. Lipid Technology 2004, 16, 252-254.
13. Mossoba, M. M., Milosevic, V., Milosevic, M., Kramer J. K. G.; Interference of Saturated Fats in the Determination of Low Levels of trans Fats (below 0.5%) by Infrared Spectroscopy. J. Amer. Oil Chem. Soc. 2007, 84, 339-342.
14. AOAC Official Method 2000.10 Editor, Howitz, W., Eds. Official Methods of Analysis; 18th Edition; AOAC International, 2010.
15. Salminen, I., Mutanen, M., Jauhiainen, M., Aro, A.; Dietary trans fatty acids increase conjugated linoleic acid levels in human serum, The Journal of Nutritional Biochemistry. 1998, 9(2), 93-98,
16. Nicolosi, R.J., Rogers, E.J., Kritchevsky, D., Scimeca, J.A., Huth, P.J.; Dietary conjugated linoleic acid reduces plasma lipoproteins and early aortic atherosclerosis in hypercholesterolemic hamsters. Artery. 1997, 22(5), 266-77.
17. Greenblatt, A.; Obesity Epidemic. Congressional Quarterly. 2003, 13(4), 73-104.
18. Oh, K., Hu, F. B., Manson, J. E., Stampfer, M. J., Willett, W. C. Dietary fat intake and risk of coronary heart disease in women: 20 years of follow-up of the nurses’ health study. American Journal Of Epidemiology 2005, 161, pp. 672-679.
19. Ceriani, Roberta., Meirelles, A.J.A., Formation of trans PUFA during deodorization of canola oil: A study through computational simulation. Chemical Engineering and Processing 2007, 46, pp. 375-385.
20. Detwiler, S. B., Markley, K. S.; Smoke, flash, and fire points of soybean and other vegetable oils. J. Amer. Oil Chem. Soc. 1940, 17, 39-40.
21. Huang, Z., Wang, B., Crenshaw, A.A.; A simple method for the analysis of trans fatty acid with GC-MS and ATTM-Silar-90 capillary column. Food Chemistry 2006, 98, 593-598.
One Response