
Courses Related to Methods
- SOCL 345 Social Research and Program Evaluation
- SOCL 346 Stats for the Social Sciences
Key Concepts of these Courses
- Research Design
- Sampling
- Data Collection Methods
- Qualitative vs. Quantitative Research
- Data Analysis
- Validity and Reliability
- Correlation and Regression Analysis
- Statistical Tests
- Statistical Software
Papers Written Throughout Different Courses
Research Findings
Faith Kelly
Department of Sociology and Criminology/Criminal Justice
SOCL 345: Social Research and Program Evaluation
Dr. Pederson
Research Question:
My research question was to see if there was a correlation between household income and a family’s involvement with my activity. The activity data that I evaluated was the data from the pizza party activity. My independent variable family involvement (v23) was measured on a scale of 1-10. 0 equaling no involvement at all and 10 equaling a great amount of involvement. My dependent variable household income was measured by ranges respondents choose either, less than $10,000, $10,000 – $30,999, $31,000 – $50,999, $51,000 – $70,999, $71,000 – $90,999, and $ 91,000 or more.
Chi-Squared:
| Engagement | Low income | High Income | Total |
| Low Engagement | 4 | 0 | 4 |
| High Engagement | 28 | 20 | 48 |
| Chi-Squared | 1.234 |
Note: p<.05* , p<.01**, p<.001***
There is no significance. The independent variable for this Chi-squared test was household income. The dependent variable was parental involvement in the activity. For household income respondents chose either, less than $10,000, $10,000 – $30,999, $31,000 – $50,999, $51,000 – $70,999, $71,000 – $90,999, and $ 91,000 or more. These variables were recoded into low- and high- income categories. Those variables were tested against the levels of engagement which were also recoded into high and low categories. According to this Chi-squared test there is no significance because the level of engagement of those who selected low income for the activity is no different from the level of engagement of those who selected one of the high-income categories. Therefore, there is not effect on involvement based on a family’s income.
Pearson’s Correlation:
The variables examined for this Pearson’s correlation were household income (v36) and family involvement (v23). The variables of household income were tested to see if there was correlation between family evolvement and certain income levels. According to this Pearson’s correlation test there is a weak positive correlation between income and family involvement which means there is not a large difference between families with low incomes involvement and families with high incomes involvement.
ANOVA:
Table 2. Analysis of Variance (ANOVA) of parent involvement on household income
| Household Income | Mean Involvement | F-value |
| Low income | 9.0 | 0.1876 |
| High Income | 9.2 |
Note: p>.05*,p>.01**, p<.001***
The dependent variable for this ANOVA was parent involvement on household income. This was asked on a range scale of less than $10,000 to $91,000. The independent variable for this ANOVA was household income. Respondents chose either, less than $10,000, $10,000 – $30,999, $31,000 – $50,999, $51,000 – $70,999, $71,000 – $90,999, $ 91,000 or more, or prefer not to answer. These variables were recoded into low- and high- income categories. The mean engagement for low household income for less than $10,000 – $50,999 was 9.0 and the mean engagement for high income $51,000 or more was 9.2. According to the ANOVA results (F=0.1876) there is no significant difference between these means. Therefore, household income does not influence parent involvement.
Conclusion
According to the chi-squared test there is no significance because the level of engagement of those who selected low income for the activity is not different from the level of engagement of those who selected one of the high-income categories. According to Pearson’s correlation test there is strong correlation between income and family involvement which means there is not a large difference between families with low incomes involvement and families with high incomes involvement. Lastly, according to the ANOVA results (F=0.1876) there is no significant difference between these means. Therefore, household income does not influence parent involvement. In conclusion after evaluating our findings we find that there is no significant correlation between the amount of the family’s income and a family’s involvement, therefore a family’s household income does not influence that amount of involvement a family has in an activity.
The Affects of Family Fun Time Activities on Parental involvement
Faith Kelly
Department of Sociology and Criminology/Criminal Justice
SOCL 345: Social Research and Program Evaluation
Dr. Pederson
November 29, 2022
Abstract
According to Epstein (1985), parental involvement is a major component of a child’s academic achievement. Therefore, parental involvement has been a major focus in education policies over the last couple of decades. However, not all studies have agreed that there is a link between parental involvement and their children’s academic outcomes. The purpose of this evaluation is to evaluate family involvement through family fun time activities. Specifically, this paper will identify if socioeconomic status affects family involvement. A questionnaire was created by 50 members of the Social Research and Program Evaluation team at Longwood University. A non-probability sample for this study was based on 99 children from a local head start program and the Andy Taylor center located on the Longwood University campus. Parents and/or guardians completed the questionnaire where they answered questions that addressed their completion of the activities, enjoyment of the activities, family involvement, and demographic information. A mixed-method study was done using open-ended (i.e. qualitative) and closed-ended questions (i.e. quantitative) questions on the questionnaire. Family quality time, social skills, and enjoyment are the primary themes evident in the responses received on the questionnaires A bivariant analysis was conducted between household income and family involvement with no clear pattern. These findings suggest that household income and socioeconomic status may not affect family involvement. The practical implication of this study is to determine if the activities help families with family involvement, this way it can be identified if family fun time activities are something that can be implemented by schools across the country to help increase parental involvement if needed.
Introduction
Parental involvement is a major component of a child’s academic achievement according to Epstein (1985). Through certain programs like Head Start, there has been a focus on how parental involvement is affecting academic achievement. However, not all studies have agreed that there is a link between parental involvement and their children’s academic outcomes. Harris & Robinson (2016) defined parental involvement as a parent’s specific actions at home or school. Their study showed no relationship between parental involvement and a child’s academic outcomes. This conflicting research suggests that there are outside forces that seem to affect children’s academic achievement like demographic factors. According to Malone (2017), socioeconomic status is a challenge for parents who want to be able to be involved in their children’s development. Malone (2017) also found that schools and their educators can come up with fun and creative ways to help parents overcome those challenges. This evaluation is significant for educators and schools to help them continue and give new ideas to develop programs for parents to be more involved in their children’s education and overcome those challenges. An idea for promoting family involvement is schools sending home pre-packaged activities with SMART objectives for the parents or guardians to do with their children to hopefully improve family involvement. The purpose of this evaluation is to evaluate family involvement through family fun time activities and analyze how the activities can promote family involvement which may have the ability to promote achievement.
Literature Review
How can family fun time activities affect family involvement? Through programs like Head Start, there has been a focus on how parental involvement is affecting academic achievement. This paper will review the important basic findings on how parental involvement affects children’s academic achievement, how socioeconomic status can affect students’ achievement, and what extent of the achievement gap is linked to specific parental involvement.
According to Epstein (1985), parental involvement is a major component of a child’s academic achievement. Therefore, parental involvement has been a major focus in education policies over the last couple of decades. So there have been many programs implemented like a head start to help students achieve in school overall. However, not all studies have agreed that there is a link between parental involvement and their children’s academic outcomes. Harris & Robinson (2016) defined parental involvement as a parent’s specific actions at home or school. Through their research, they propose a paradigm that is called “stage setting”. This is when children can have good academic achievement if their parents keep up a safe space for learning that favors healthy communication. This study shows no relationship between parental involvement and a child’s academic outcomes. According to Ansari and Gershoff (2016), the two most frequently cited reasons for not being involved pertained to parents’ work schedules and children’s school schedules. This means that socioeconomic status can affect how much time parents spend with their children. Dearing et al. (2006) found this when they examined family involvement in school and children’s literacy performance in an ethnically diverse and low-income sample.
According to Dearing et al. (2006). The average literacy performance of a child can be low if the mother is less educated, however, if the family involvement levels were high then the achievement gap is unseen. Chung et al (2019) found that there is a relation between a child’s outcomes and both their parent’s parental contribution. Both parents have a varying impact on the child so a correlation is not possible without considering both parents.
According to Malone (2017), socioeconomic status is a challenge for parents who want to be able to be involved in their children’s development. Malone (2017) also found that schools and their educators can come up with fun and creative ways to help parents overcome those challenges. Ansari and Gershoff (2016) found that with the help of the parental involvement program head start that parents who were involved in the program had children that showed an increase in their academic achievement. However, Menheere and Hooge (2010) revealed different practices that help improve parental involvement. These include parent and teacher training for family interventions and for the students’ school structure.
In conclusion, further research can be examined to identify what extent to which the achievement gap is linked to involvement. The conflicting research suggests that there are many different ways that outside forces seem to affect children’s academic achievement like demographic factors as well as cultural and racial factors. It is also unknown what is effective parental involvement and why it is effective in promoting a children’s development. As a result of this, educators and schools should continue to help and create programs for parents to be able to be involved in their children’s education.
Data and Methodology
Instrument
A survey questionnaire was created by 50 members of the Social Research and Program Evaluation team at Longwood university. The survey asked both open and closed-ended questions. Items on the survey were designed to evaluate SMART objectives of five activities that were completed the previous week by Head Start and Andy Taylor Center families. Items were included that also addressed demographic information, enjoyment of the activities, family involvement, and completion of the activities. Hard copies of the questionnaire were delivered to Head Start and the Andy Taylor center.
Sample
The non-probability sample for this study was based on 99 children (ages three-five years old). Seventy-nine children attend Head Start in three counties. Head Start is a federally subsidized preschool for families with economic needs. Twenty-one children attended the Andy Taylor Center which is located on a college campus, and families apply and pay for their children to attend. Attached to the questionnaire was a children’s book to incentivize families to return the survey. Guardians of the children were asked to complete the survey and return it to the preschool the next day. Teachers sent a reminder home with children to return outstanding questionnaires. This resulted in 16 questionnaires being returned. Overall, there was a 16% response rate.
Quantitative Analysis
Quantitative analysis of the returned surveys was based on closed-ended questions. For this study, the dependent variable is family involvement. For this study, the independent variable is household income. The items from the questionnaire that was used to operationalize this was, “What is your annual household income?”. The answer choices for this item were less than $10,000, $10,000 to $30,999, $31,000 to $50,999, $51,000 to 70,999, $71,000 to $90,999, $91,000 or more, and prefer not to answer. Descriptive statistics were used to analyze these variables.
Qualitative analysis
Qualitative analysis of the returned surveys was based on open-ended questions. The open-ended questions on the survey were, “What did your family enjoy most about these activities? Why?”, “What did your child learn from these activities?”, and “What recommendations would you suggest to make these activities better?”. To answer the research question, “How do family fun time activities affect family involvement?”, inductive open coding was used to determine reoccurring themes in the respondents’ responses.
Quantitative findings
For this study, the dependent variable is family involvement. The item from the questionnaire that was used to operationalize this was, “How involved was your family throughout the activity?”. The answer choices for this item were coded on a scale from zero to ten. Zero is not at all and ten is a good amount. The mean of this variable is 9.36. The standard deviation for the variable is 1.08.
For this study, the independent variable is household income. The items from the questionnaire that was used to operationalize this was, “What is your annual household income?”. The answer choices for this item were less than $10,000, $10,000 to $30,999, $31,000 to $50,999, $51,000 to 70,999, $71,000 to $90,999, $91,000 or more, and prefer not to answer.
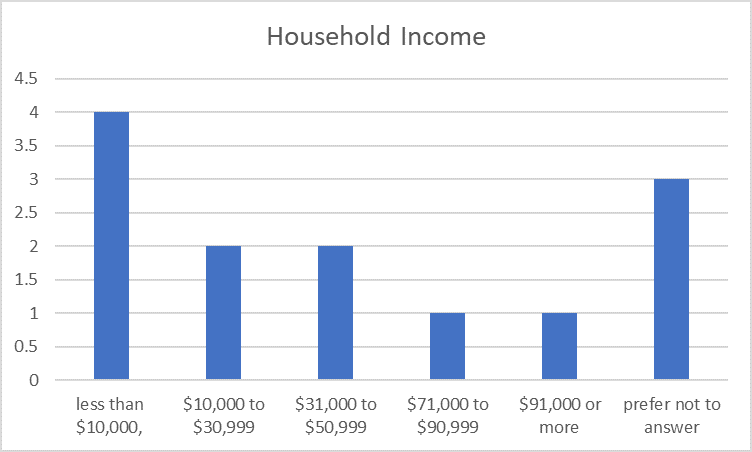
Four respondents made less than $10,000 a year, two respondents made $10,000 to $30,999, two respondents made $31,000 to $50,999, one respondent made $71,000 to $90,999, one respondent made $91,000 or more, and three respondents said that they preferred not to answer.
A bi-variant analysis was conducted. The mean involvement score of respondents who make an income of less than $10,000 is 9.25. The mean involvement score of respondents who made $10,000 to $30,999 is 10. The mean involvement score of respondents who made $31,000 to $50,999 is 8.50. The mean involvement score of respondents who made $71,000 to $90,999 is 10.00. The mean involvement score of respondents who made $91,000 or more is 10. The mean involvement score of respondents who said that they preferer not to answer is 9. There is no clear pattern within this data. There is not enough data to accurately describe what is happening with family involvement based on household income. There are varying correlations between family involvement and the family’s income.
Qualitative Findings
The question within this research is how Family fun time activities affect family involvement. In the open-ended questions responses, there were three common themes: social learning, learning, and time spent together. Respondent two stated, “[child’s name] learn how to cut and glue, and how to trace better.” By this, the respondent feels as if the activity is beneficial to their child because the child learns how to do certain tasks like cutting, gluing, and tracing. Respondent 7 stated, “My child learned how be creative.” By this, the respondent feels as if the activities help their child with developing their creative skills. Respondent 10 stated that their child learned “letters, numbers, how to take turns, and also a little bit of reading.” By this, the respondent implies that their child learned certain academic learning skills like letters, numbers, and reading.
Another common theme throughout the respondent’s answers was social learning. Respondents 9 and 10 stated that their child learned “how to take turns…” By this, the respondents believe that they have seen an improvement in certain social skills of their children. Respondent 4 stated that the activities are given “helped with mood, to be patient.” This response indicates that these activities can provide the child and family with a way to boost their mood, and also to teach the child and family to be patient with each other while they are all learning how to do new things. Respondent 14 stated that the activity “takes time and patience to complete things but it can also be fun.” This response implies that the child doing the activity can have struggles and have to take their time but they learn from that struggle and it can be entertaining for the child. Respondent 15 states that their child learned “patience, not giving up if something doesn’t go her way or look how she expected it to.” By this response, the respondent believes that their child learned how to accept certain failures or setbacks and learn how to understand that things don’t anyways go the way people want them to.
A third common theme of the open-ended questions is that the activities encourage togetherness. Respondent 1 states that they enjoyed “a free convenient activity to do as a family.” By this, the writer seems to enjoy the activity because it was free and simple and encouraged their family to do something together. Respondent 4 states that their family enjoyed “time spent together, the talks, learning.” By this, the respondent seems to have enjoyed the time the family spent together doing the activity and enjoyed the talks that it encouraged. Respondent 10 states that their family enjoyed “doing them together. [students name] says she loves doing things with mom and dad.” By this response, the respondent implies that their child enjoyed the activities because they were able to spend time with their parents which makes them happy. Respondent 12 states that their family enjoyed “spending time together doing something educational is always fun. “Family Time”. By this response, the respondent seems to have enjoyed spending time with their family while also the activity provides something educational for them to do together.
Conclusion
The main purpose of this evaluation is to analyze the family fun time activities’ affect on family involvement. Each activity provided opportunities for learning. There were three common themes found throughout the qualitative analysis which were: social learning, learning, and quality time. There is no clear pattern within the data analyzed in the quantitative findings. There was not enough data to accurately describe what is happening with family involvement based on household income. There are varying correlations between family involvement and the family’s income due to the survey response rate being 16%. Overall, there could be further research on the effectiveness of programs and activities that promote family involvement, however, those who responded to the survey enjoyed the activities. It is unknown what is effective parental involvement and why it is effective in promoting a child’s development, however from this evaluation it can be seen that prepackaged family fun time activities do effectively promote family involvement based on the open-ended questions of the survey. It can also be seen that parents rely on the speed of completion of these activities. The evaluation also shows that mothers were the primary respondent to the surveys. This provides a basis for building new research on this topic. New research could be conducted to focus on the fathers’ involvement in the family’s fun time activities.
References
Angel L. Harris, & Keith Robinson. (2016). A New Framework for Understanding Parental Involvement:
Setting the Stage for Academic Success. RSF: The Russell Sage Foundation Journal of the Social Sciences,2(5),186–201. https://doi.org/10.7758/rsf.2016.2.5.09
Ansari, A. and Gershoff, E. (20ap16), Parent Involvement in Head Start and Children’s Development:
Indirect Effects Through Parenting. Fam Relat, 78:562-579. https://doi.org/10.1111/jomf.12266
Chung, G., Phillips, J., Jensen, T. M., & Lanier, P. (2020). Parental Involvement and Adolescents’
Academic Achievement: Latent Profiles of Mother and Father Warmth as a Moderating Influence. Family Process, 59(2), 772–788. https://doi.org/10.1111/famp.12450
Epstein, J. L. (1985). Home and School Connections in Schools of the Future: Implications of Research
on Parent involvement. Peabody Journal of Education, 62(2), 18–41. http://www.jstor.org/stable/1492874
Dearing, E., Kreider, H., Simpkins, S., & Weiss, H. B. (2006). Family involvement in school and low-
income children’s literacy: Longitudinal associations between and within families. Journal of Educational Psychology, 98(4), 653–664. https://doi.org/10.1037/0022-0663.98.4.653
Malone, D. (2017). Socioeconomic status: A potential challenge for parental involvement in schools. Delta
Kappa Gamma Bulletin, 83(3), 58-62.
Menheere, A., & Hooge, E. H. (2010). Parental involvement in children’s education: A review study
about the effect of parental involvement on children’s school education with a focus on the position of illiterate parents. Journal of the European Teacher Education NetworkJETEN, 6, 144-157.
Pungello, E. P., Iruka, I. U., Dotterer, A. M., Mills-Koonce, R., & Reznick, J. S. (2009). The effects of
socioeconomic status, race, and parenting on language development in early childhood. Developmental Psychology, 45(2), 544–557. https://doi.org/10.1037/a0013917
Stats Reflection
Faith Kelly
Department of Sociology and Criminology/Criminal Justice
SOCL 346: Stats for the Social Sciences
Dr. Pederson
This class as given me certain skills like analytical thinking, sampling techniques, and quantitative data description and analysis. This class has also given the ability to use R, SPSS, and Excel for data analysis and inferential statistics. Specifically, I have learned the difference between various statistical techniques and the proper techniques for different research questions and data. I learned how to recode data into SPSS and RStudio, how to find the measure of central tendency, how to find measures of variability, how to find Z-scores and probability, how to find confidence intervals, t-tests, analysis of variance, Chi-squared test, correlation, and regression. Therefore, this course has provided me with the skills and materials help make me better at hypothesis testing and theoretical modeling. This course has also required me to create a statistics manual. This statistics manual was created to describe everything that I have learned in this course in my own words.
I have learned a lot of things from my time at Longwood university. One of course that I have learned a lot from is Sociology 346 which is a Statistics course for the social sciences. In a larger context this course has provided the skills that give me the ability to convey complex statistical information to a diverse audience. I have gained a better comprehension of doing research and evaluating a research question on my own. I feel even more confident about my ability to evaluate and comprehend quantitative and qualitative findings. I also feel better about my ability to evaluate survey and questionnaire data. Being able to evaluate any type of data is important because it helps me be able to explain data and my research hypothesis when I understand statistics.
The skills I have learned from this class can be useful for me to know for my future career. This is because statistics is the primary analytical method in social sciences. These skills could benefit me if I were to pursue an academic career or pursue graduate programs because my statistical ability could impact my research potential and my performance. The skills I have learned can also benefit me when if I were to decide to pursue a non-academic career because some jobs require experiences with data management and analysis. This course has required me to create a statistics manual. This manual I have created can help me in my future career or job because it can help me do whatever analysis I need to do in any way that is required of me.
Writing Reflection
In reflecting upon my three papers from methodology courses, I can discern changes in my writing style and approach, which has become sociological and concept heavy over time. In my first paper about my research findings of my data provide a in depth analysis. It was focused on data techniques and general research concepts. However, as I progressed through the papers, I became more adept at integrating the relevance of specific techniques, concepts, and data throughout the research process. This shows an increase in my critical thinking skills and evaluation skills. The writing structure of The Affects of Family Fun Time Activities on Parental involvement paper provides a in depth critical analysis of all my research during my social research and program evaluation course. This paper provides an analysis and evaluation of data from surveys. This paper provides an integration of the explanation of the data collection methods, the data, and the qualitative research with the overall statistics. This involved identifying the strengths, limitations, and interpretations which allowed me to become more insightful with my writing. My writing through these papers has progressed, this can be seen through my evaluations of data and research. I have overall developed stronger research analysis skills, stronger ability to evaluate data, and a more structured writing style. As I gained more experience and familiarity with writing about methodology, my writing ability likely improved in several ways. I may have become more adept at expressing complex ideas clearly and concisely, using appropriate terminology and language, and crafting compelling arguments supported by evidence.