
Pearson’s Correlation
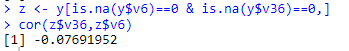
- Directions on how to find Correlation in R-Studio
- z <- y[is.na(y$v6)==0 & is.na(y$v36)==0,]
- cor(z$v36,z$v6)
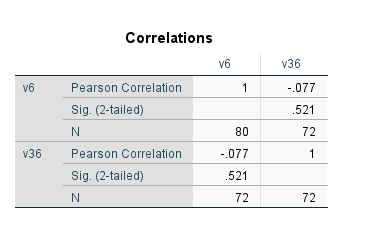
- The Pearson’s Correlation Coefficient data presents that the level of parent engagement (dependent variable, v6) was compared to the independent variable (v36) of family household income. The dependent variable was obtained through responses on a scale of 1 being not involved to 10 being involved a great amount. For the family household income, this was measured based off of responses of “less than $10,000”, “$10,000-$30,999”, “$31,000-$50,999”, “$51,000-$70,999”, “$71,000-$90,999”, and “$91,000 or more”. The overall correlation between parent engagement (v6) and annual family income (v36) is -0.08, which is a weak negative correlation.