Abstract
Counterfeit pharmaceuticals are an increasing trend in the world of criminal activity because the business of making fake pharmaceuticals is highly profitable. The scientific community needs to develop clear-cut methods of detection for counterfeit pharmaceuticals because this is an issue that affects human health and because the use of prescription drugs is so prevalent. This study used high-pressure liquid chromatography (HPLC) and fluorescence spectroscopy to produce qualitative and quantitative data about quinine, mefloquine, and choloroquine. These were studied because they are common anti-malarial drugs used in developing nations and they are often counterfeited. Tablet mixtures meant to replicate pharmaceutical tablets were prepared and analyzed using HPLC to have concentrations ranging from 11 to 62 ppm. Fluorescence spectroscopy determined suitable emission and excitation wavelengths for quinine and mefloquine to be 455 nm and 250 nm respectively and 465 nm and 365 nm for chloroquine.
Introduction
Counterfeit pharmaceuticals are an increasing trend in the world of criminal activity. This mainly stems from the reality that the business of making fake pharmaceuticals is highly profitable.[1] A counterfeit medication is defined by the World Health Organization (WHO) as a drug that is intentionally labeled incorrectly which means it could have an incorrect product name or source listed. This definition applies to both brand and generic drugs. Counterfeited drugs may have the correct ingredients but incorrect labeling, the wrong ingredients, low or no active ingredients. [2]
Detecting fake pharmaceuticals in developed countries is easier than detecting counterfeits in underdeveloped nations because more financial support and advanced technology exists. In industrial nations, medications that are counterfeited often are drugs that are used for comfort such as hormones and antihistamines.[3] The problem with detection of fake pharmaceuticals in third world countries is that the most often counterfeited drugs are those that treat life-threatening illnesses which include antibiotics and anti-malarials. WHO cites that developing countries have the highest percentages of drug counterfeits; in certain areas about 25 percent of drugs are fake and in some areas as high as 50 percent of the drugs being used are counterfeit.[4] The scientific community needs to develop clear-cut methods of detection for counterfeit pharmaceuticals that technicians in developing countries can easily learn how to operate.
The three active ingredients studied in this research were chloroquine, mefloquine, and quinine because they are the most common active ingredients in anti-malarials.3 The structures of these active ingredients are shown in Figure 1. It is important to quantify the amount of active ingredient in the drug because many counterfeits contain small amounts of the active ingredient in order to pass simple drug quality checks that include color tests.5

Figure 1. Structure of chloroquine (A), quinine (B), and mefloquine (C).
The research focused on developing quick and simple methods for detecting counterfeit anti-malarial drugs and quantifying the active ingredients. Ultraviolet-Visible (UV-Vis) spectroscopy was used to characterize the molecules on a spectrum in order to identify peaks obtained from high-pressure liquid chromatography (HPLC). UV-Vis spectroscopy produces information about how much incident light of a particular wavelength is being absorbed by the sample. UV-Vis is useful for the molecules being studied because quinine, mefloquine, and chloroquine have double bonds within the cyclic structures of the molecules that absorb UV light.
Fluorescence spectroscopy was investigated as a less expensive and more efficient method of detection. It works by exciting the molecules of the compound and then detecting the amount of photons released after the molecules relax to ground state. Fluorescence is useful with the molecules being researched because it works optimally with molecules containing conjugated double bonds and structural rigidity. Structural rigidity enables the electrons to lose their energy to fluorescence and not to vibrational or rotational relaxation.
HPLC works by using a pump to move a mobile phase and a mixture of analytes along a stationary phase and a detector that determines the amount of time each analyte takes to elute from the column. This project will focus on analyzing mixtures of the active ingredient with common cutting ingredients such as silica, sucrose, talc, etc.3
HPLC has been used to determine concentrations of chloroquine, mefloquine, and quinine. In a study done by Gaudiano et al, compounded pills with varying formulations with and without the active ingredient were created and analyzed using HPLC. In the pills where active ingredient was present, it was detected at 98-102% of the expected amount. Some of the inactive ingredients included those frequently used by counterfeiters such as silica, sucrose, maize starch, and talc.3 Some counterfeiters will even put pain relievers such as acetaminophen into the counterfeit medications to make the patients think they are recovering from their illness.1
HPLC is able to separate mixtures of molecules within one sample; this is exceptionally useful for tablets that may contain only a small portion of the real active ingredient and largely contains a false active ingredient. This instrument produces chromatograms containing peaks that indicate when the sample eluted the column which is also known as the retention time. Chromatograms are graphs that display absorbance on the y-axis and time on the x-axis. This specific instrument has a multi-wavelength detector called a diode array detector (DAD). The DAD produces a spectrum for each time point on the chromatogram. The ability to distinguish the chromatogram peaks based on data about various wavelengths is important when the sample is a mixture of different molecules. For example, a sample with several compounds that absorb at different wavelengths has to be analyzed only once because the DAD detects data for a complete range of wavelengths. The type of HPLC used was reversed-phase meaning the column is non-polar while the mobile phase is relatively polar.
When choosing mobile phases, it is important to know whether the molecules of interest are hydrophobic or hydrophilic because hydrophobic molecules will elute quicker with an organic mobile phase while the hydrophilic molecules will elute with an aqueous phase. Another way to vary the mobile phases and to have better peak separation is by employing the use of a mobile phase gradient. Usually gradients begin with a greater aqueous mobile phase percentage so that polar molecules will elute and then as the gradient changes to a higher percentage of organic mobile phase, the less polar molecules will begin to elute. If only one molecule of interest exists in the sample then an isocratic gradient can be used in which only one mobile phase is used and is made to suit the polarity of the molecule. Filtering all samples and any solvents used that are not HPLC grade is important because the small column can easily be clogged. A guard column can also be used to collect any particulate matter that would have otherwise entered the column.
In order to assure reproducibility of the results between the sample runs, the oven can be used so that the temperature can be set to remain the same during each run. Increasing the temperature can also allow the samples to elute quicker. A diagram of a typical HPLC is shown in Figure 3.

Figure 3. This is a diagram illustrating the various parts of the HPLC. The solvent reservoir contains the mobile phases. The degasser is a vacuum that pulls out any air bubbles to ensure better peak separation. The detector for the particular HPLC used in this study was a multi-wavelength detector called a diode array detector (DAD).
Scientists focused on this urgent crisis have employed both simple and complicated methods to distinguish between real and fake pharmaceuticals. Some simple methods include thin-layer chromatography (TLC) and colorimetry. TLC shows a qualitative comparison between the active ingredient in the sample drug and a known standard. Colorimetry is a reaction between the sample and a reagent to yield a color, which is usually indicative of the amount of active ingredient. Although usually the color is proportional to the concentration of the active ingredient, the results of colorimetry tests are not quantitative because they are still based on a person’s subjective comparison to a color chart. A group of scientists led by Michael Green at the Centers for Disease Control and Prevention in Atlanta, Georgia created a colorimetric test for determining the quality of artesunate, an anti-malarial drug. The test was based on the yellow color created when artesunate was mixed with a base, a buffer and a reagent.2 Another study was done to detect quinoline which is a structure found within quinine, mefloquine and chloroquine. The structure is shown in Figure 2.[5]

Figure 2. Structure of quinoline which is found within mefloquine and chloroquine.
One problem with colorimetry tests is that these tests are easily passed by counterfeiters. One such test for artesunate detected a free amine, which is a functional group that contains nitrogen. When counterfeiters learned of this, they merely added a free amine to the mixture and their drugs were able to pass the test. 4
This research project is meant to create a foundation of knowledge about detecting the common anti-malarial active ingredients, chloroquine, mefloquine, and quinine using simple and inexpensive tests. In order to ensure quantitative data, HPLC will be used to determine specific concentrations. Qualitative and semi-quantitative data were ascertained using fluorescence spectroscopy.
Experimental
HPLC
All standards and samples were analyzed on a Shimadzu Prominence. A mobile phase was made using 14 M H3PO4, phosphoric acid, and filtered DI water. The mobile phase was 50 mM and had a pH of 1.7. Stock solutions were made for quinine sulfate dihydrate which was purchased from ACROS Organics, mefloquine phosphate which was purchased from Spectrum Chemical and chloroquine hydrochloride which was purchased from Spectrum Chemical. The drug was then dissolved in 25 mL of the H3PO4 mobile phase which yielded a 1000 ppm solution. Mixture standards were made and yielded standard concentrations were 1, 5, 10, 20 and 25 ppm. The second mobile phase used was HPLC grade acetonitrile. The H3PO4 was mobile phase A and the acetonitrile was mobile phase B (mpB). The gradient was as follows: from 0-2 minutes, mpB was held constant at 10%, from 2-10 minutes, the mpB changed from 10% to 90%, from 10-11 minutes, mpB was changed back to 10% and then from 11-15 minutes it was held constant at 10%. The method included a sample injection of 10 mL and a flow rate of 1 mL/min for the mobile phases. The standards were analyzed using HPLC employing the method as just described.
Tablet mixtures were made to replicate the conditions of actual pharmaceutical tablets. The amounts of active ingredients varied from the amount found in a real prescription to lesser amounts. The active and inactive ingredients are listed in Table 1.
| Active Ingredient(s) | Inactive Ingredients | |
| Tablet A | Quinine (324 mg) | Talc, magnesium stearate, corn starch |
| Tablet B | Chloroquine (500 mg) | Polyethylene glycol, calcium phosphate, cornstarch, magnesium stearate |
| Tablet C | Mefloquine (90 mg) | Lactose, magnesium stearate, talc, cornstarch |
| Tablet D | None (Blank mixture) | Cornstarch, magnesium stearate, talc |
| Tablet E | Quinine (200 mg) | Cornstarch, magnesium stearate, talc |
| Tablet F | Chloroquine (300 mg) | Polyethylene glycol, calcium phosphate, cornstarch, magnesium stearate |
| Tablet G | Aspirin (324 mg) | Talc, magnesium stearate, cornstarch |
| Tablet H | Acetaminophen (324 mg) | Talc, magnesium stearate, cornstarch |
| Tablet I | Aspirin (224 mg), quinine (100 mg) | Talc, magnesium stearate, cornstarch |
Table 1. Amounts of active and inactive ingredients.
Tablets E and F were made to emulate counterfeit drugs that had decreased amounts of the active ingredient. Tablet G and H were made to imitate a quinine tablet but these tablets had a different active ingredient, either aspirin or acetaminophen. The lactose, polyethylene glycol, potassium phosphate, calcium phosphate and talc were all purchased from Fisher Scientific Company. The cornstarch was purchased from Wal-mart and was Great Value brand. The magnesium stearate was purchased from MP Biomedicals, LLC. The quinine sulfate dihydrate was purchased from ACROS organics. Amounts of these tablet mixtures ranging from 10 to 20 mg were diluted using the H3PO4 mobile phase to detectable concentrations of active ingredients that ranged from 0 to 12.5 ppm. The solutions were placed in an ultrasonic bath for 5 minutes to ensure that all soluble particles were dissolved. Each solution was then filtered using 0.45 mm nylon filters to clear any particulate matter and then analyzed using HPLC.
Fluorescence
Each stock solution was analyzed using the Cary Eclipse Fluorescence Spectrophotometer. Several solvents were made and used for this part of the research. A 50 mM potassium phosphate, KH2PO4 buffer was made and used initially. Concentrated phosphoric acid, H3PO4, was added to the solution in order to lower the pH and yield a buffer solution that had a pH of 2.9. Sulfuric acid, 50 mM H2SO4, with a pH of 1.2 was also used as a solvent to determine the effect of pH on fluorescence intensity. The mobile phase of H3PO4, which had a pH of 1.8, was also used to test the effects of the phosphate ion. Standards were prepared for each active ingredient consisting of the following concentrations: 0.0001, 0.001, 0.01, 0.1, and 1.
UV-Vis
Solutions of the drugs were analyzed on an Agilent UV-Vis 8453. All three 1000 ppm stock solutions of each drug were diluted using the mobile phase, 50 mM H3PO4, in a 1:10 ratio.
TLC
Several TLC methods were attempted during this research using Whatman 4410-222 TLC plates PE SIL G/UV254 with flexible polyester backing. All three stock solutions were spotted along the TLC plate along with tablet mixtures A, B and C. The solution tablet mixtures were the same as the ones used for HPLC. Method 1 involved using methanol as the mobile phase. Method 2 was gradually adding acetic acid to increase the polarity of the mobile phase. The final method, method 3, was dissolving quinine and chloroquine, separately, in methanol and also using methanol as a mobile phase.
Results and Discussion
HPLC
The initial information obtained from HPLC was the calibration curves for quinine, mefloquine, and chloroquine which are shown in Figure 5.

Figure 5. (A) quinine, (B) mefloquine, (C) chloroquine.
The chromatogram for each mixture standard showed two peaks that could be characterized through their spectrum as either quinine or chloroquine while no discernible peak existed for mefloquine. An example chromatogram for standard four is shown in Figure 6.

Figure 6. Standard 4.
The retention time for quinine was usually around 5.5 minutes and was around 7.5 minutes for chloroquine. A cluster of peaks appeared from 13-15 minutes on each chromatogram. These peaks were later determined to be caused by contaminants in the mobile phase. Chromatograms with useful peaks were successfully obtained for the tablet mixtures. An example chromatogram for tablet A is shown in Figure 7.

Figure 7. Tablet A.
As shown in Figure 7, a peak for quinine was produced around 5.5 minutes and the unknown contamination peaks were produced around 13-15 minutes.
As shown in Figure 6, a peak for mefloquine was unable to be obtained and it was thought to be due to low molar absorptivity coupled with low concentrations. The original 1000 ppm stock solution of mefloquine was analyzed as well as a freshly made 1000 ppm solution. The data produced supported the idea that mefloquine is unstable in solution as shown by the chromatograms in Figures 9 and 10.

Figure 9. New mefloquine 1000 ppm solution.

Figure 10. Old mefloquine 1000 ppm solution.
The new stock solution produces absorption of over 1750 mAU in Figure 9. This chromatogram was produced by a stock solution that was under 2 weeks old. The chromatogram in Figure 10 was produced by a stock solution that was several months old and the peak for mefloquine has an absorbance of around 900 mAU. The only variable between the two solutions is the time they remained on the shelf before being analyzed using HPLC and the absorbencies prove that mefloquine is unstable in solution and explains why mefloquine was unable to produce a peak in the original standards.
Not only were the main active ingredients able to be distinguished using HPLC but other false active ingredients such as acetaminophen and aspirin were separated. An example chromatogram of tablet H which contained acetaminophen as the false active ingredient in place of quinine is shown in Figure 8.

Figure 8. Tablet H.
The retention times determine for acetaminophen and aspirin were 4 and 6.5 minutes respectively. Using both the information for retention times and spectra, acetaminophen and aspirin were distinguished from the actual anti-malarial active ingredients.
After the standards, the tablet mixtures were analyzed using HPLC as well. The resulting concentrations are shown in Table 2.
| Tablet | Active Ingredient | Experimental Amount (ppm) | Expected Amount (ppm) |
| A | Quinine | 62 | 80 |
| B | Chloroquine | 11 | 13 |
| C | Mefloquine | 12 | 2.0 |
| D | None (Blank mixture) | 0.0 | 0.0 |
| E | Quinine | 13 | 4.7 |
| F | Chloroquine | NQ* | 7.2 |
| G | Aspirin | NQ* | 7.7 |
| H | Acetaminophen | NQ* | 7.8 |
| I | Aspirin, Quinine | NQ*, 21 | 5.4, 2.4 |
Table 2. Concentrations of active ingredients as determined through the use of HPLC.
*Not quantifiable
Although some of the experimental data are comparable to the expected data, such as the case for tablet A and B, most of the concentrations do not seem to coincide. This is believed to be due in part to inadequate mixing of the tablet ingredients. Another problem that could have taken place is that most of the inactive ingredients are hydrophobic and when the tablet mixtures were being diluted, the hydrophobic components could have caused the active ingredient to become separated from the solution. This might also have happened because the active ingredients such as quinine, chloroquine, and mefloquine did not dissolve into solution easily.
Fluorescence
In an effort to develop a quick, inexpensive method of analysis, fluorescence was chosen because the molecules being studied fluoresce well due to their structural rigidity. Fluorescence spectroscopy produces results faster than HPLC and it is significantly cheaper. Fluorescence is cheaper because it does not require the constant flow of mobile phase or expensive columns. Overall, it could be a helpful tool in determining presence as well as concentrations of active ingredients.
It was found through the use of several solvents that a quenching effect occurred due to pH. The final solvent that was determined to be most suitable for this research was phosphoric acid, H3PO4.
It should be noted that the fluorescence data is preliminary and many of the issues that arose during research were unable to be completely solved due to time constraints.
In order to determine the presence of quinine or chloroquine, excitation at 250 nm would be useful as shown in Figure 11.

Figure 11. Emission spectrum for all three active ingredients with excitation at 250 nm.
Since the emission intensities for quinine and chloroquine are very different then it would be possible to characterize those active ingredients using the 250 nm excitation wavelength. It would not be feasible to verify the presence of mefloquine at this excitation wavelength because its absorbance intensity could be mistaken for that of quinine. However, if an unknown tablet was analyzed at this wavelength and determined to not have chloroquine because the molecule was yielding high emission intensity then it could be analyzed at another wavelength to determine whether the tablet contains either quinine or mefloquine. The excitation wavelength that could be useful to differentiate between quinine and mefloquine is 365 nm. The emission spectrum shown for this excitation wavelength is in Figure 12.

Figure 12. Emission spectrum for all three active ingredients with excitation at 365 nm.
As this spectrum shows, this wavelength would not be useful in verifying the presence of chloroquine versus quinine however it is useful in distinguishing between quinine and mefloquine. Mefloquine barely produces emission intensity at this excitation wavelength. In conclusion, by exciting the sample at both of these wavelengths, it could be possible to determine the active ingredient.
Once the active ingredient is verified, the concentration could be determined by exciting the sample at a suitable wavelength and using the resulting intensity and a calibration curve. Experiments were done to determine the best excitation and emission wavelengths for each molecule. The emission wavelengths were scanned from 300 nm to 500 nm and were determined by changing the excitation wavelength at every 5 nm interval from 250 nm to 400 nm. Chloroquine was found to have an emission peak at 370 nm and it produces the highest intensity when its excited at 280 nm. Mefloquine was characterized with an emission peak at 455 nm which was best excited at 250 nm. Quinine had similar data which was an emission peak at 450 that had its highest intensity when it was excited at 250 nm. Since aspirin and acetaminophen are commonly added as false active ingredients, the emission and excitation data were determined for those drugs as well. Aspirin had an emission peak at 350 nm which was best produced by exciting the molecule at 290 nm. Acetaminophen had an emission peak at 310 nm which had the highest intensity when the molecule was excited at 425 nm. Because the data for aspirin and acetaminophen are unique, it would be useful in determining whether a tablet was counterfeited by using either of these ingredients in comparison to the three anti-malarial ingredients.
Although the process for producing qualitative and quantitative data from fluorescence spectroscopy would take several steps, it would still be less costly and faster than HPLC. This is because the same sample would be used during each step of analysis and the only adjustments would be on the instrument while the sample remained in the cuvette.
UV-Vis
The UV-Vis spectrometer was primarily used to characterize the molecules on a spectrum. It was used to obtain what wavelengths at which the molecules absorbed the highest. The spectrum including all three molecules is shown in Figure 13.

Figure 13. UV spectra for the three active ingredients.
TLC
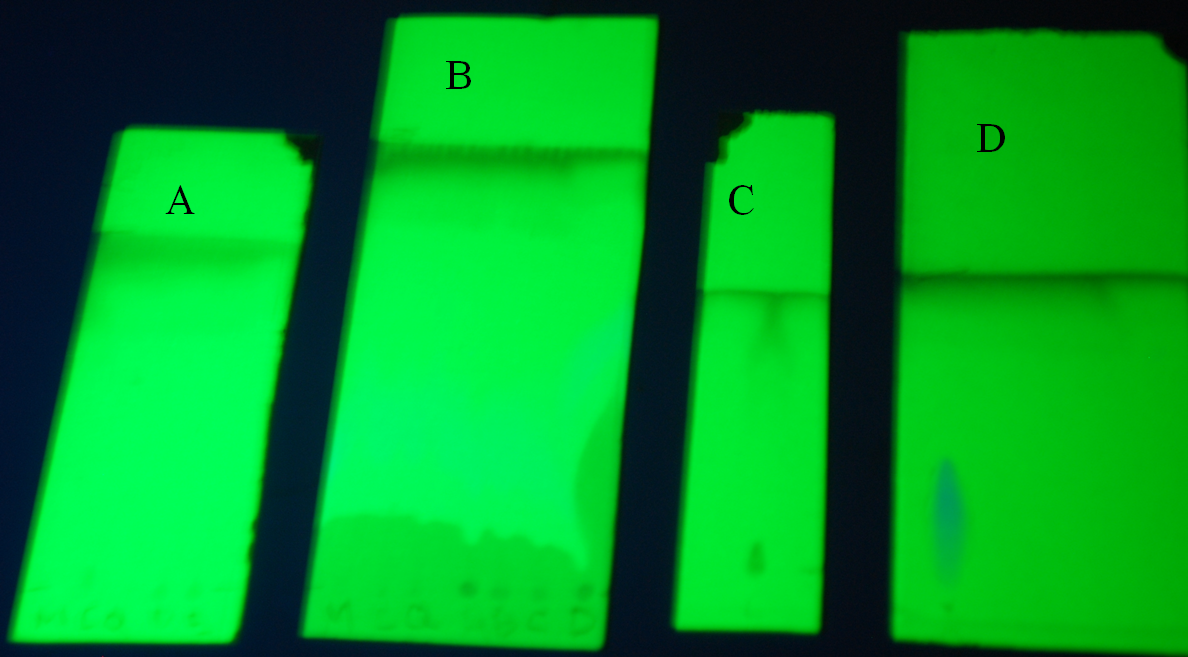
TLC was studied to verify whether this would be a useful method due to its inexpensiveness and ability to rapidly produce results. The results for the three methods used for TLC are shown in Figure 14.

Figure 14. A: TLC plate using method 1; B: TLC plate using method 2; C, D: TLC plates using method 3.
Method 1, which used methanol as the mobile phase, was unable to move the spots of standards and tablet solutions. Method 2, which added acetic acid to methanol to create a more polar mobile phase, was also unable to move any spots as shown in component B of Figure 14. Method 3 which consisted of dissolving a generic amount of active ingredient into methanol and also using methanol as the mobile phase was able to move the spots of standards and tablets. TLC is not useful when concentrations of active ingredients are low because the spots of tablet mixtures did not fluoresce as well as the stock solutions and sometimes not at all.
Conclusions and Future Work
Due to the prevalence of counterfeit pharmaceuticals and the danger they present to human health, it is important for scientists to develop useful methods of detection for commonly counterfeited active ingredients in pharmaceuticals. The research done has found that HPLC and fluorescence spectroscopy were effective in producing qualitative and quantitative data about quinine, mefloquine, and choloroquine.
In the future, the issues encountered during this research should be studied further. Since the data for the tablet mixtures from HPLC did not coincide with the expected values, it would be beneficial to develop an efficient method of blending and dissolving the tablets. It was determined that mefloquine is instable in solution so solution stability tests should be done. Since fluorescence proved to be a useful tool in detecting the presence and concentration of the active ingredients then the tablets should be analyzed using this instrument.
Acknowledgements
First, I would like to thank Dr. Sarah Porter for her continued support and guidance throughout my research. Working with her was always a pleasure and I will always be grateful for having the opportunity. I would also like to extend my gratitude to the Department of Chemistry and Physics as well as the Cormier Honors College for the financial support and lab use during my project. Their financial support enabled me to present my research at the 241st American Chemical Society National Meeting and Exposition in Anaheim, California. I am also grateful for all of the support that I have received throughout my education at Longwood University from my parents, Michael and Tina Irby, and my little brother, Andrew. Lastly, I would not have been able to maintain my sanity without my supportive boyfriend, Jonathan Leist.
References
[1] Everts, Sarah. Fake Pharmaceuticals. Chemical and Engineering News, January 2010, pp 27.
[2] Deisingh, A.K. Pharmaceutical Counterfeiting. The Analyst. 2004. 271, 273.
[3] Gaudiano, M. C.; Antoniella, E.; Bertocchi, P.; Valvo, L. Development and validation of a reversed-phase LC method for analysing potentially counterfeit antimalarial medicines. Journal of Pharmaceutical and Biomedical Analysis. 2006, 132, 134.
[4] Mukhopadhyay, Rajendrani. The Hunt for Counterfeit Medication. Analytical Chemistry. 2007, 2624, 2626.
[5] Kaur, H.; Green, M. D.; Hostetler, D. M.; Fernandez, F. M.; Newton, P. N. Antimalarial drug quality: methods to detect suspect drugs. Therapy. 2010. 50.