
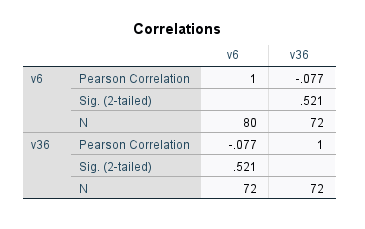
Correlation in SPSS:
- Go to SPSS and open up your data set
- Go to analyze, correlate, then bivariate
- Drag V6 and V36 over to the variable box
- Click OK
Correlation in R:
- Go to R and open your project
- Enter onto a new line and being typing in the top left quadrant:
- #Chapter 10 – Correlation
- z <- y[is.na(y$v6)==0 & is.na(y$v36)==0,]
- cor(z$v36, z$v6)
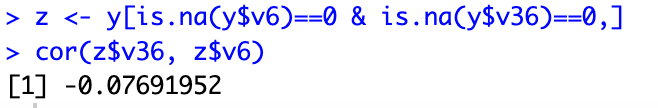
- There is a weak negative correlation (r = -0.0769) between parent involvement and income.
The above notes and charts show that the independent variable is family involvement (v6) while the dependent variable is income (v36). The correlations in the above graphs have a weak negative correlation between involvement and income.