
The goal of our evaluation research was to find out if family fun time activities would improve family involvement. My group was the Obstical Course. Our variables were recoded into interval ratios over the course of the research and my research question for this study is: What affect does socioeconomic status have on family involvement? To help answer my research question, I used multiple tests in programs such as Rstudio and SPSS. These two programs are great tools to help show the information in a cleaner format and to help provide visuals on the information given. Correlation, Regression, and ANOVA are tests that I will use to help answer the research question.
Correlation:
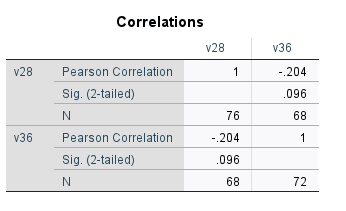
A Correlation test tests the degree of association between Z variables. In the chart to the left, there are two variables, v28, and v36. V28 is my socioeconomic status and V36 is my family involvement variable. To show if socioeconomic status and parent involvement have either a positive or negative correlation we look at the “Pearson’s Correlation” row. For family involvement, its correlation is -.204, and for socioeconomic status, its correlation is also -.204. This shows that both socioeconomic status and parent involvement have a weak correlation with each other. This means socioeconomic status and family involvement do not have any affect on each other.
Chi-Squared:
The next test is a Chi-Squared test, in our Chi-squared, our independent variable was parent engagement and our dependent variable was income. There were 12 parents in total who did not feel engaged. While there were 44 total parents who did feel Engaged. The chi-squared value was 0.28125 and it is significant to the .05 level. The table indicates that familys with both low and high incomes felt more engaged with their children doing the activities provided to them rather than no engagement at all.
Table 1: Chi-squared of parent engagement by income
| Low Income | High Income | Total | |
| Not Engaged | 4 | 4 | 12 |
| Engaged Chi-Square | 28 | 16 | 44 0.28125 |
Note. p<.05*, p<.01**, p<.001***
T-Test:
The mean parent involvement score for low-income Head Start families was 8.14 and the mean parent involvement score for high-income Andy Taylor Center Families was 9.80 out of 10. The t-test value was 2.54 and it is significant at the .001 level. Therefore, the mean parent involvement is significantly different. This test shows that families still showed engagement with the activities regadless of their current socioeconomic status.
Table 1: Independent samples t-test of parent involvement by income.
| Mean Parent Involvement | t | df | |
| Head Start | 8.44 | 2.54** | 28.00 |
| Andy Taylor Center | 9.80 |
Note. p<.05*, p<.01**, p<.001***
Conclusion
The goal of our evaluation research was to find out if sending out family fun time activities to 99 families would improve family involvement. The findings from my statistical models: Correlation, Chi-squared and T-test showed that the families that participated in the Obstacle Course activity showed that regardless of their current economic status, that it did not affect their involvement with their children and the activity. In conclusion, this research shows that statically, families with either low socioeconomic income or high socioeconomic income has no affect on family involvement.