
Parent involvement from this data should show how parents that are more engaged in their child’s academic life would lead to greater success for the child’s improvement for education. Parents tend to show more interest in these fun activities if they have more time to spend with their children which could lead to mutual relationships between both. The whole ideology of this experiment was to see how much time and determination parents have when spending time with their children which could lead to the overall performance of how their child benefits in society among themselves or around their peers.
Quantitative Findings
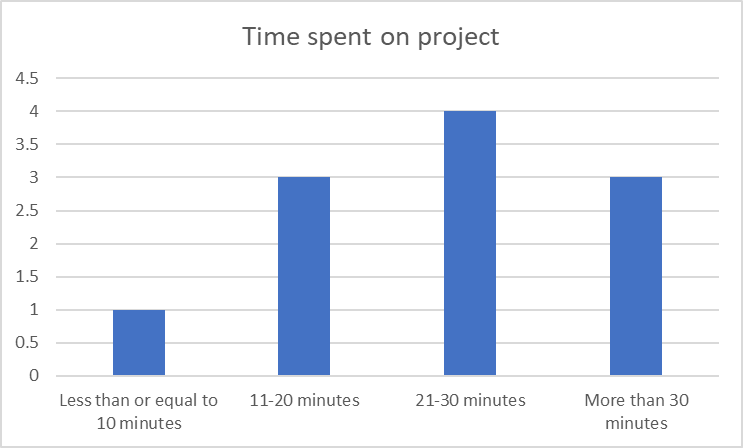
The quantitative data from my dependent variable question was “How much time did you spend on the project?” The data indicate that one respondent spends less than or equal to ten minutes, three respondents spend eleven to twenty minutes, four respondents spend twenty-one to thirty minutes, and three respondents spend more than thirty minutes. The overall meaning of this dataset would indicate how much time parents are spending with their children while completing each fun activity. The positive correlation from this dataset should show that the more time parents spend on completing the fun activities with their children it would simply show how much they were involved. The dependent variable is “how much time spent on the project?” which shows more respondents spend twenty-one to thirty minutes on each activity.
The quantitative data from the independent variable question was “what is your race/ethnicity?” The answer choices were Latino/Hispanic, White (Non-Latino), Black or African American, Asian, Pacific Islander, Native American, Middle Eastern, Multiracial, Other, and Prefer not to answer. The overall meaning for this dataset simply identified the race of the parents and how many of the respondents were of a particular race through this project on parent involvement. From the demographic information, the data shows six respondents were Black or African American and four respondents were White (Non-Latino).The independent variable is “what is your race/ethnicity?” The data shows that more respondents were Black or African American.
The bivariable analysis from both my dependent and independent variables correlates towards each other’s basic off parent involvement. The chart below will show how much time the parent spent on each fun activity, and it will show which race of the parent spends the most time with their child. The data shows that white parents spend less time with their children than black parents. The purpose of this project was to see how much effort parents are involved in their children’s lives. The activities display exactly how parents spend most of their time being engaged in all the fun activities, and it was very interesting that black parents spend more time with their children than white parents.

T-Test
Table 1.
T-test involvement in race
| Race/Ethnicity | Mean | t-statistics |
| White | 2.25 | -5.5485** |
| Black | 3.33 |
Note. p<.05*, p<.01**, p<.001***
This chart displays the independent variable of race/ethnicity. Respondents only answered “White” or “Black”. The dependent variable is involved in an activity which is coded 0 to 10. The mean for people who responded “White” is 2.25. The mean for people who responded “Black” is 3.33. There is a significant difference between these means (p< .01). The t-statistic is -5.5485. After viewing this table chart the reader should be able to identify the race/ethnicity of the parents who participated in this survey as either white or black. Therefore, by looking at the quantitative attribute of the table chart it clearly states that there were more black parents that participated in this survey than white parents.
Chi-square
Table 2. Chi-square on race/ethnicity of parents who spend more time on the project with their child
| Less than or equal to 10 minutes | 11-20 minutes | 21-30 minutes | Chi-square | |
| White | 27 | 0 | 9 | 65.000*** |
| Black | 0 | 36 | 18 |
Note: p<.05*, p<.01**, p<.001***
The dependent variable for this Chi-square chart was how much time a child spent on the project. Respondents chose either less than or equal to 10 minutes, 11-20 minutes, 21-30 minutes, and more than 30 minutes. The independent variable for this Chi-square chart was what is your race/ethnicity. Respondents chose either white or black. After viewing the chart, you can infer those 27 white parents spend less time on the project with their children. Whereas 36 black parents spend more time on the project with their children. The Chi-square in this data is (65.00) < .001 therefore there is a significant difference between these two categorical variables in the chart.
The reader should be able to interpret from this chart the race/ethnicity of the parents and the amount of time they spend doing this survey with their children. After reviewing the data, it should be clear to the reader to see that black parents spend more time doing this activity with their children and white parents spend less time doing this activity with their children.
ANOVA
Table 3. Analysis of Variance (ANOVA) of child spend time on the project by household type
| Household Type | Mean of child involvement | F-value |
| Multigenerational | 2.0 | 0.165 |
| Single parent | 3.2 | |
| Two- parent | 2.6 | |
Note: p<.05*, p<.01**, p<.001**
The dependent variable for this ANOVA was how much time a child spends on the project. Respondents chose either less than or equal to 10 minutes, 11-20 minutes, 21-30 minutes, and more than 30 minutes. The independent variable for this ANOVA was the household type. Respondents choose either, “two-parent”, “single-parent” or “multigenerational.” The mean of child involvement for two-parent and single-parent households was 2.6 and 3.2. The mean for child involvement for multigenerational households was 2.0. According to the ANOVA results (F=0.165) there is no significant difference between the means. Therefore, household type does not influence child involvement.
In this table chart I had to use v32 the household type and I kept my dependent variable to the same v3 time spent on the project. After viewing the data, it should be clear to the reader that most of these children are being raised in a single parent household.
After reviewing this activity there is a reasonable explanation that black parents spend more time with their child on school activity versus white parents. There is another ethical dilemma to take away from this study would be that most children from a household with only one parent or guardian. The purpose of this research was to see how parents choose to spend more time with their children prior to just school work but in every day life as well.