
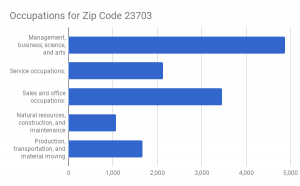
For the first data analysis I completed, I decided to analyze data on occupations for Zip Code 23703. I chose this Zip Code because this is the Zip Code in which I live. While analyzing a great amount of data, I was able to narrow down the data, eliminating any unnecessary information. While narrowing down the data, I was able to make a chart which displayed the data perfectly. This chart, displaying the data using bars, shows the availability of certain occupations within the Zip Code 23703. As this availability is shown, it is clear which occupations are more available than others. For example, occupations for management, business, science, and arts are much more available than occupations for any other field. As I am planning on staying in the area after graduation, I will keep this data in mind when applying for jobs in the real world.
https://factfinder.census.gov/faces/tableservices/jsf/pages/productview.xhtml?src=CF
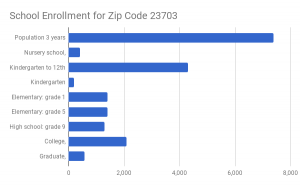
For the second data analysis I completed, I decided to analyze data on school enrollment for Zip Code 23703. As I kept the Zip Code the same for both data analyses, I changed the topic to learn more about the area in which I am living. After conducting research and analyzing a great amount of data on this topic, I feel more knowledgeable on school enrollment numbers within my area. While gaining more knowledge during the completion of this data analysis, it is clear to me that school enrollment is higher in lower education than higher education. Similar to the first data analysis I completed, I eliminated unnecessary information. This portion of the data analysis became extremely important as displaying data for the intended audience is the main focus. When displaying information for the intended audience, it is important to arrange the information in a comprehensive way, while also grasping their attention.
https://factfinder.census.gov/faces/tableservices/jsf/pages/productview.xhtml?src=CF