
Table 4.
Correlation between involvement and enjoyment in SPSS
- Analyze
- Correlate
- Bivariate
- Drag two variables that are Interval/Ratio into the box on the right (v7 and v11)
- Click “OK”
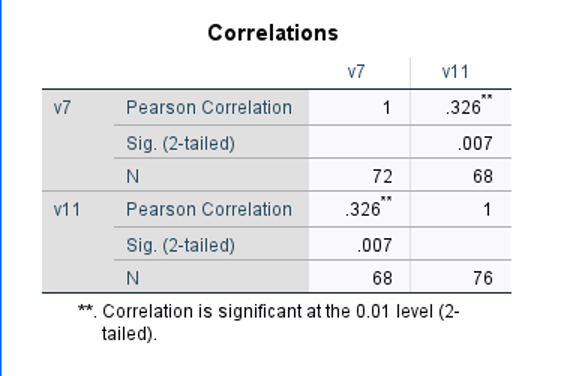
(Above is a successfully-run correlation in SPSS)
Correlation is the measured degree of association between two Interval/Ratio variables. Both direction and strength are measured. Direction can be either positive or negative. Strength ranges from -1 (Strong Negative Correlation) to +1 (Strong Positive Correlation). The dependent variable for this correlation was involvement in activities. This was asked on a 0-10 scale. The independent variable for this correlation was enjoyment of activities. This was asked on a 0-10 scale. The correlation between involvement of activities enjoyment is .326. This is a moderate positive correlation with significance at the .01 level.
Correlation between involvement and income in R
- #Chapter 10 – Correlation
- z <- y[is.na(y$v11)==0 & is.na(y$v36)==0,] (<–This is your syntax)
- cor(z$v36, z$v11)

(Above is a successfully-run correlation in R)
Correlation is the measured degree of association between two Interval/Ratio variables. Both direction and strength are measured. Direction can be either positive or negative. Strength ranges from -1 (Strong Negative Correlation) to +1 (Strong Positive Correlation). The dependent variable for this correlation was involvement in activities. This was asked on a 0-10 scale. The independent variable for this correlation was household income. Respondents chose either “Less than $10,000”, “$10,000 – $30,999”, “$31,000 – $50,999”, “$51,000 – $70,999”, “$71,000 – $90,999”, “$91,000 or more”, or “Prefer not to answer”. The correlation between involvement of activities and income is -0.03. This is a weak negative correlation with no significance.