
The variables that I used for this correlation test were income and family involvement. Income was measured based on the average amount of money a family makes in a year. Family involvement was measured on a scale of 0-10. They are both interval/ratio variables which is need for running a correlation test. The results of this test show that there is a weak positive correlation (r =.19) between the variables. The strength of the results shows that between the two variables there is very little correlation.
How to Find Correlation in SPSS:
Step 1: Open SPSS
Step 2: Click Analyze
Step 3: Go to Correlate
Step 4: Click Bivariate
Step 5: Move Dependent and Independent Variable into the variables box
- For this example, I am using v17 as my dependent variable and v36 as my independent variable
- Correlation only works with interval/ratio variables
Step 6: Click OK
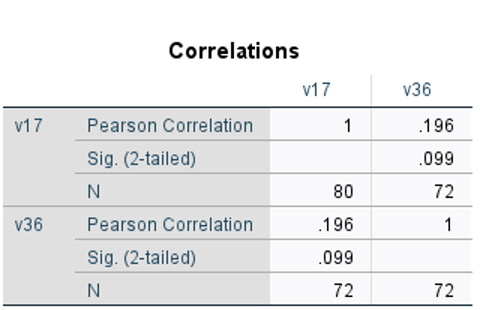
Interpretation: There is a weak positive correlation (r = .19) between income and family involvement.
How to Find Correlation in Rstudio:
Step 1: Input the following syntax using your Dependent and Independent variables
z<-y[is.na(y$v17)==0 & is.na(y$v36)==0,]
cor(z$v36,z$v17)
Step 2: Click Run
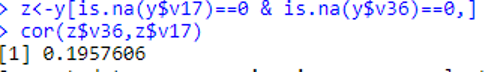
Interpretation: There is a weak positive correlation (r =.19) between income and family involvement.