
Table 1:
Independent Sample T – Test of Student Overall Semester Experience by Support of Mask Policy.
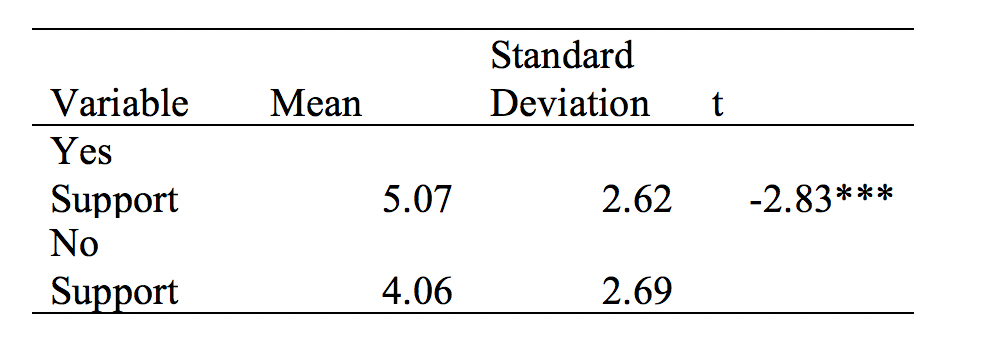
Note: N =433
Note: p< 0.05 *, p < .01 **, p < 0.001***
The table above represents a T – Test that involved the individual’s overall semester experience that was ranked on a scale of 0 -10. The T – Test also included individual’s support of the mask policy at Longwood University. Data collected from Mask Policy support was collected from a survey question that included answer choices of “Yes”, “No”, “Maybe” or “Other”. This data was recoded into answers categories of “Yes” or “No”. The data was collected from a survey sent to Longwood University students in the fall of 2020.
The means of individuals who supported the mask policy was 5.07. This data shows that the average individual response toward support of the Longwood University mask policy and their overall experience at Longwood University this semester would be ranked in the middle of a scale. This means that students who support the mask policy, have around an average experience this semester. That implies that the students were not highly satisfied or highly dissatisfied with their semester along with the mask policy enacted by Longwood University.
The mean of individuals who did not support the mask policy was 4.06. This data shows that individuals who reported not supporting the mask policy, can be assumed to have a less pleasurable experience during the semester. This shows that students would not be satisfied with their semester experience due to the mask policy, other policies enacted by Longwood university, and cancelation of other events such as Oktoberfest, convocation and other events alike.
The standard deviation of individuals who were in support of the mask support was 2.62. The standard deviation of those individuals who did not support the mask policy was 2.69. An independent samples t – test was run, and t was equal was -2.83. This finding was significant at the .001*** level.