
Chapter 11: Regression
OLS Regression- Ordinary Least Squares Regression
What is regression?- A regression estimates the relationship between a dependent variable and one or more independent variables.
- The outcome allows the researcher the conditional expectation of the dependent variable when the independent variable takes on a given set of values
- This also allows the researcher to determine the exact average change in the dependent variable given and independent variable and controlling for other independent variables.
R2 – Tells the researcher how much of the radiation the Dependent Variable has explained
How to do a Regression in R studio
Steps-To start select which groups will be compared
- In this instance the level of family involvement will be compared based on household income.
- To run a regression in R studio, type in this formula:
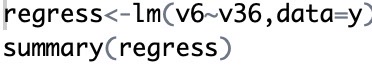
- regress<-lm(v6~v36,data=y)
2. summary(regress)
- Once it is typed in exactly correctly, highlight and click run
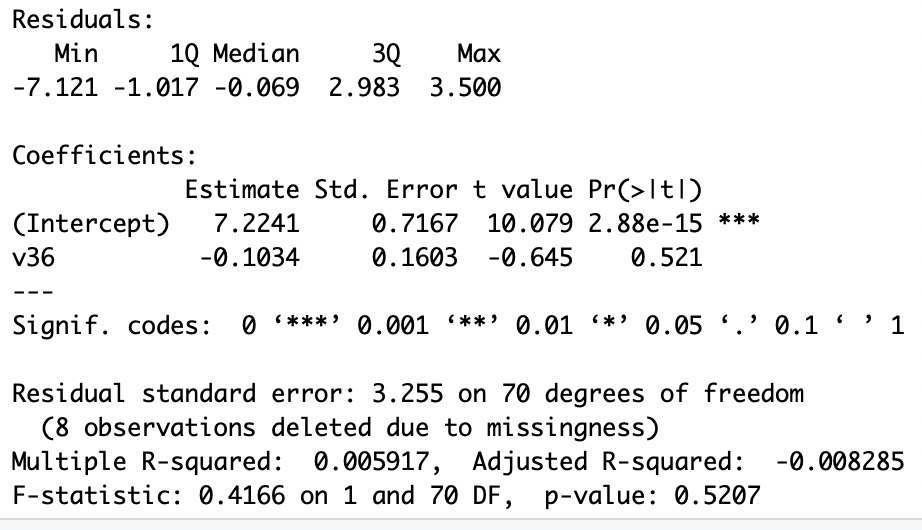
Interpretation- I hypothesized that families that have a better enjoyment of an activity will have a higher household income. In other words, how much you enjoy an activity would influence household income. For every one-unit increase in enjoyment, household income increases -0.1034. Therefore, it appears that household income is negatively related to enjoyment. This finding is not significant at the .05 level. The R2is 0.005917, meaning that this model explains 0.59% of the variation in the dependent variable (involvement).