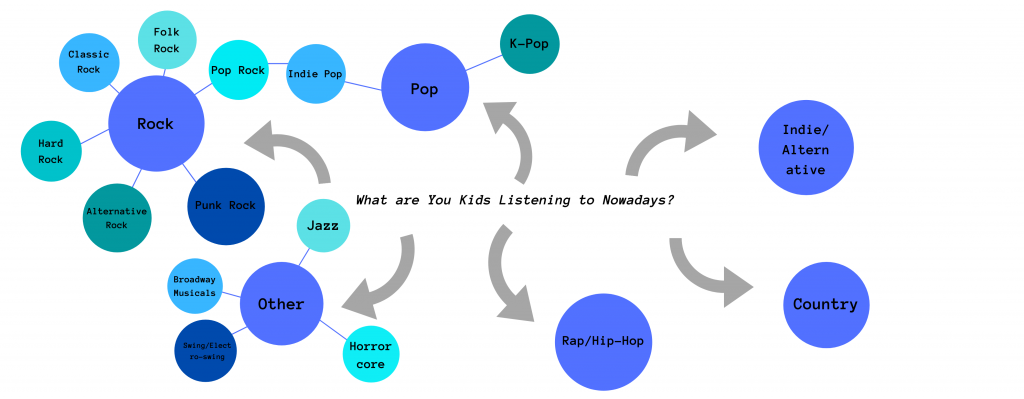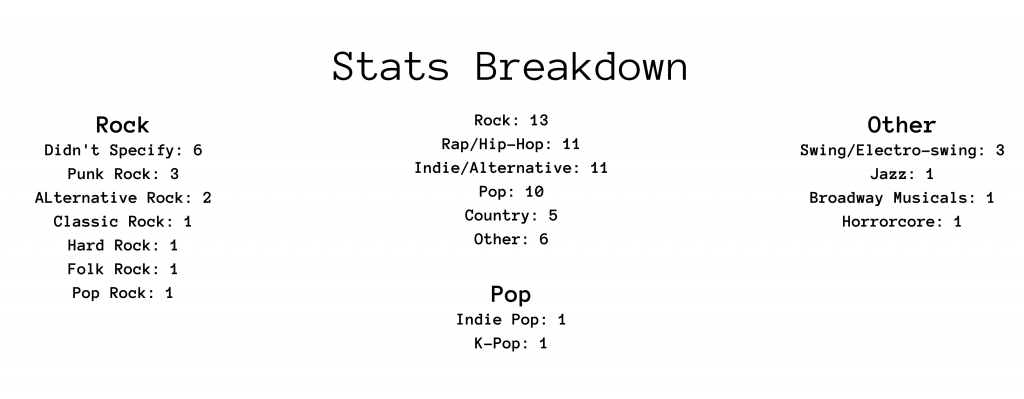

My topic for this infographic was asking freshman students around wheeler what their favorite music genre was. I then recorded it and mapped out the answers according to how specific they were.
I think my insistence on using a lot of text in the first project did not pay off in the long run. Although it worked for that situation, I seriously had trouble once I had to to get rid of text. My first draft was supremely unpopular and I was not looking forward to redoing my whole project in two days. Thankfully, I pulled it off in what my teacher described as a “hail mary.” I would say that is accurate. Although I personally enjoy reading lots of text in my infographics, I learned I need to keep audience in mind. I wasn’t making it for me, I was making it for others. I think the second draft is objectively better than the first. More than anything I learned how important a good visual representation of data can be. It can make all the difference in how your audience receives something. My old draft had the same colors and data as this one, but it was far better. And yet, this improvement was not found in making it more complex or adding more parts, but rather simplifying and shortening.
I chose this particular blueish-green color palette because of my white background. They clashed least and meant I could put less work into the background and text color. I had the genres where people specified an answer on one side, and where they didn’t on the other to provide a semblance of symmetry. The size of the circles kind of lines up with the data but it was hard to make it perfect because of the size constraints of the template I was working in. The font was chosen for its lack of seriousness and sophistication which I thought fit this topic.
