Chapter 10- SPSS
Click “Analyze” at the top and go all the way down to “Correlate”
Then click “Bivariate”
Move your independent and dependent variables into the “Variables” box.
Then click “Ok”
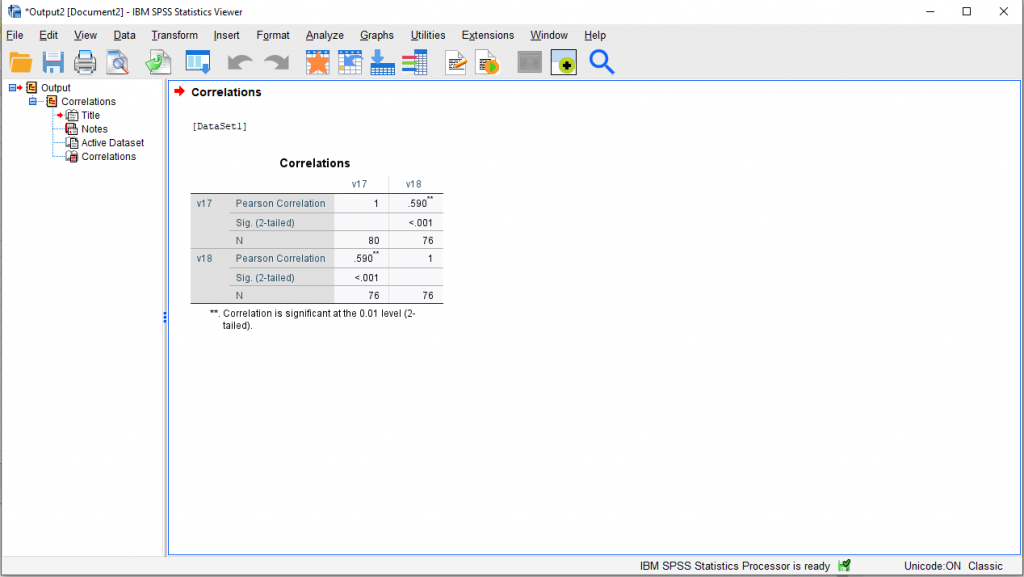
The independent variable for the Pearson Correlation table above was enjoyment, measured on a scale from 1-10 (1-5 being less enjoyment, and 6-10 being more enjoyment). The dependent variable for the Pearson Correlation table above was engagement, measured on the same scale of 1-10 (1-5 being not engaged, and 6-10 being engaged). According to the results, there is a moderate positive correlation (r=.590) between the involvement and enjoyment of the family throughout the activities.
Chapter 10- RStudio
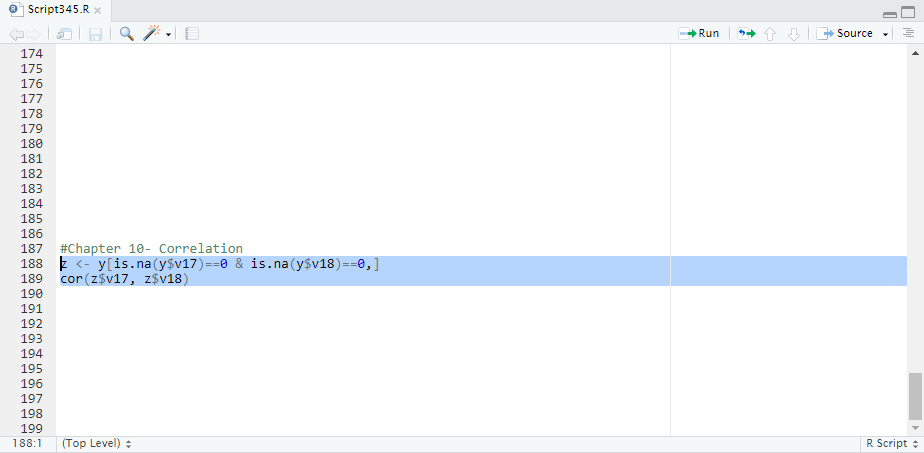
In the script box type in what is shown below.
z <- y[is.na(y$v17)==0 & is.na(y$v18)==0,]
cor(z$v17, z$v18)
Then highlight the syntax, as shown below.
Then click “Run” at the top right corner of the script box. Results should show what is shown below.
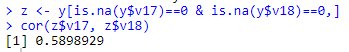
The independent variable for the Pearson Correlation table above was enjoyment, measured on a scale from 1-10 (1-5 being less enjoyment, and 6-10 being more enjoyment). The dependent variable for the Pearson Correlation table above was engagement, measured on the same scale of 1-10 (1-5 being not engaged, and 6-10 being engaged). According to the results, there is a moderate positive correlation (r=.5898) between the involvement and enjoyment of the family throughout the activities.