The following 3 videos showcase the Deeplabcut tracking (top two views) and the Anipose 3D rendering (bottom screen).
Stability tracking:
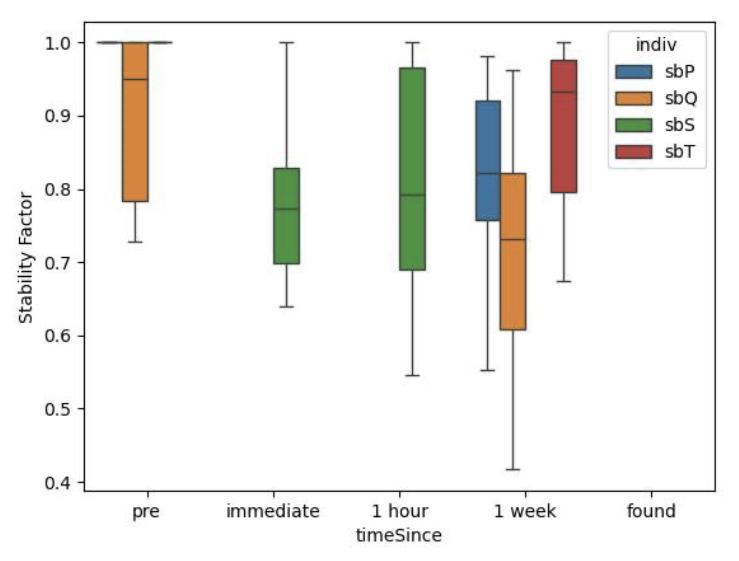
Figure 1. Missing data due to problems with calibration. Stability factor calculated as the percentage of a stride cycle that the COM falls within the polygon of support.
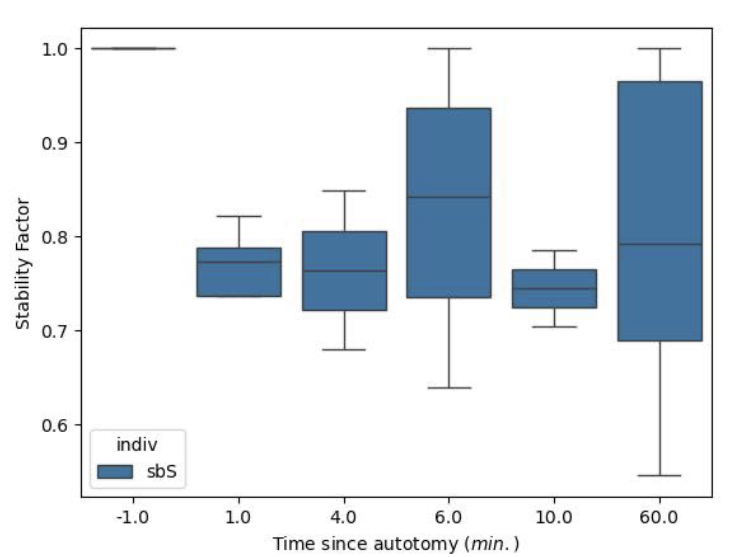
Figure 2. Stability factor of sbS over 1 hour post autotomy. Loss of stability after autotomy, with no significant evidence of improvement over the course of 1 hour. Note the large variability in stability after autotomy. Stability factor calculated by taking the percentage of a stride cycle that the COM falls within the polygon of support.
Yaw and Pitch:
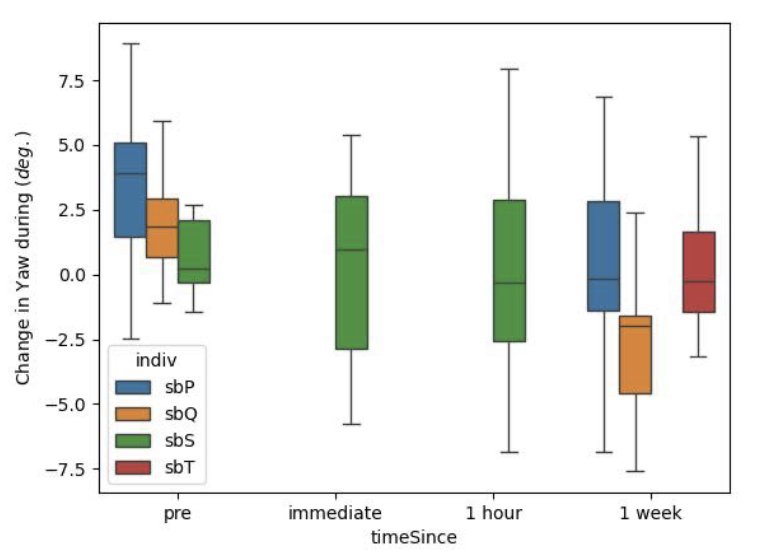
Figure 3. Yaw per stride does not change greatly with autotomy or time, indicating no effect on heading, but some bugs were observed to walk a little sideways after autotomy.
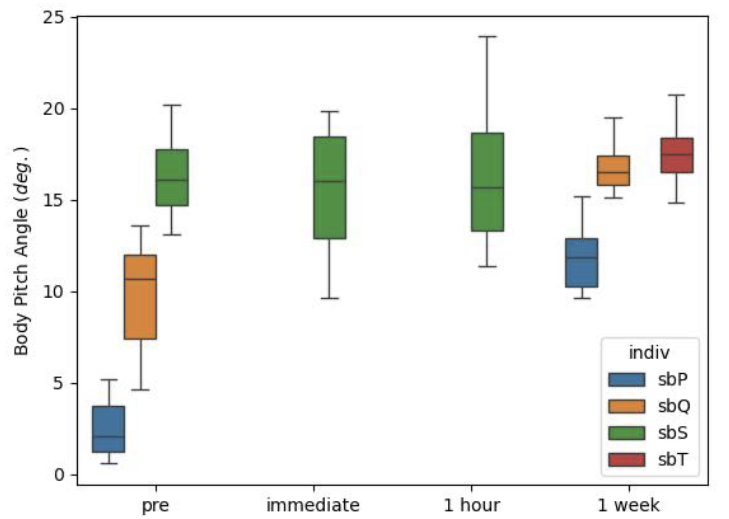
Figure 4. Median body pitch during a stride cycle. Variation among individuals in how autotomy affects pitch . Since the front leg is missing, it would be predicted that pitch would decrease, but if it changes it increases.
Performance:
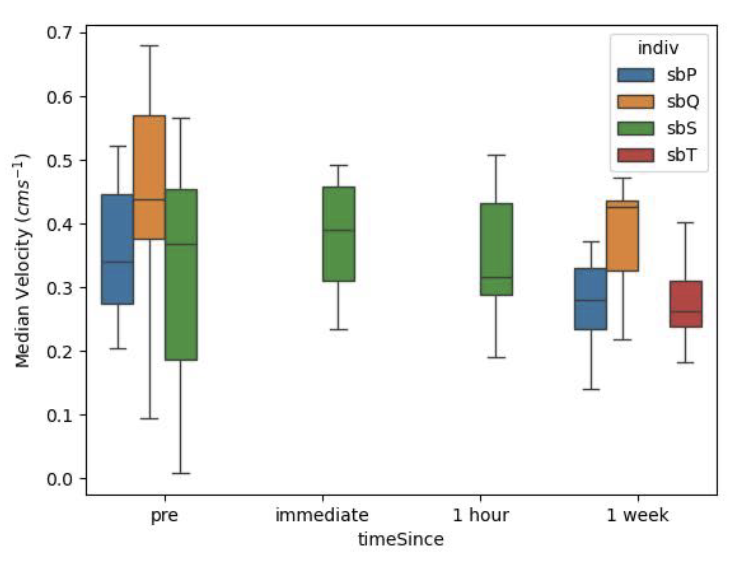
Figure 5. Median stride cycle velocity. Note that the bugs were not encouraged to go any certain speed. However, there is no significant change after autotomy or with time.
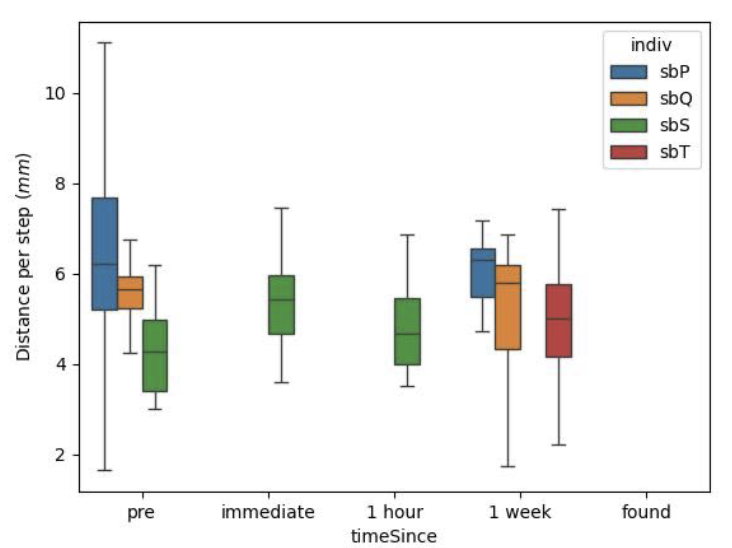
Figure 6. Distance traveled per stride does not seem to be affected significantly by autotomy.
The following animations were generated in Blender from the 3D coordinates generated by Anipose. Modeling and animation by Brian White.
