
The research problem for this study is, “Will Family Fun Time Activities encourage parental involvement?”
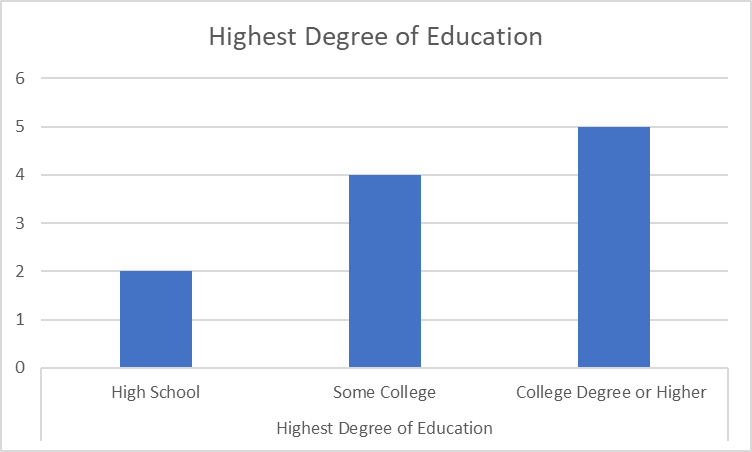
The independent variable of this study is highest degree of education in the household. The answers to the question that measures this variable are as follows: 1. Less than High School, 2. High School, 3. Some College, 4. College degree or higher, and 5. Prefer not to answer. This question had a total of 11 responses and no respondents stated less than high school or prefer not to answer as their answer. 45% of the respondents stated that the highest degree of education in the household is college degree or higher. 36% of the respondents stated that the highest degree of education in their household was some college. 18% of the respondents stated that the highest degree of education in their household is High School. Table 1 displays the descriptive statistics for this variable.
Table 1. Highest Degree of Education
The dependent variable of this study is level of encouragement for the family to spend time together. This question, that measures the level of this variable, had a scale from 0 to 10, 0 being not at all and 10 being a great amount. This question had 10 responses. The average response was 9.2, claiming that the activity encouraged their family to spend time together greatly. The standard deviation is 1.23. The mode is 10. The median response was 10, which shows a good number of respondents answered with 10. 60% of the respondents selected 10, 20% selected 9, and 20% selected 7. Table 2 displays the descriptive statistics.
Table 2
Encouragement
| Mean | Median | Mode | S.D | |
| Level of Encouragement | 9.2 | 10 | 10 | 1.23 |
Using a bivariate analysis, the independent variable and dependent variable are found to be related. Respondents who stated their highest education in their household being High School also answered 10, as their average answer, on the scale of how much they felt the activity encouraged their family to spend time together. Respondents who stated their highest degree of education in their household is some college, averaged an answer of 9 on the scale of how much the activity encouraged their family to spend time together. Respondents who stated their highest education in their household is a college degree or higher averaged an answer of 9 on the scale of activity encouragement. From previous studies, it is found that a lack of parental involvement leads to barriers of academic achievement (Wilder, 2013). In this study, it was found that no matter how high the highest level of education in the house is, this activity encouraged the family to spend time together greatly. This agrees with the previous research. People with a lower education level tend to work long hours outside of the house, leading to less parental involvement. As found, no matter the level of education, this activity encouraged parental involvement greatly. A higher level of parental involvement inside and outside of school correlates positively with student academic success (Reynolds, 1992).
Table 3
Mean encouragement by highest degree of education
| Highest Degree of Education | Mean |
| High School | 10 |
| Some College | 9 |
| College Degree or Higher | 9 |
The dependent variable for this ANOVA was encouragement of family to spend time together. This was asked on a 0-10 scale. The independent variable for this ANOVA was highest education obtained in the household. Respondents chose either, “High School”, “Some College”, or “College”. The mean encouragement for some college and college was 9. The mean encouragement for high school was 10. According to the ANOVA results (F=5.8) there is a significant difference between the means (p<.01). Therefore, highest education obtained in the household does influence the amount of encouragement for the family to spend time together.
Table 4
| Highest Education in Household | Mean Encouragement | F-value |
| High School | 10 | 5.8** |
| Some College | 9 | |
| College | 9 |
Note: p<.05*, p<.01**, p<.001***
The dependent variable for this two-way chi-square test was encouragement of family to spend time together. This was asked on a 0-10 scale. The independent variable for this two-way chi-square test was highest education obtained in the household. The answers for this variable were “College Degree”, “Some College”, and “High School”. The dependent variable was recoded into two groups. The first group was named “Slightly Encouraged”, being answers 0-7.5. The second group was named “Encouraged”, being answers 7.5-Inf. The independent variable was recoded into two groups as well. The first group was named “College Degree”, being the answer college degree. The second group was named “GED”, being answers high school degree and some college. The number of respondents who answered, “Slightly Encouraged” and chose “College Degree” was 9. The number of respondents who chose “Slightly Encouraged” and “GED” was also 9. The number of respondents who chose “Encouraged” and “College Degree” was 36. The number of respondents who chose “Encouraged” and “GED” was 36. With the X-Square value being 0, there is no significant difference between the relative frequency of people in each category.
Table 5
| Highest Education in the Household | College Degree | GED | X-Squared |
| Slightly Encouraged | 9 | 9 | 0 |
| Encouraged | 36 | 36 |
Note: p<.05*, p<.01**, p<.001***
T-test for amount of encouragement that the Astronaut Pudding activity had on the family spending time together depending on highest level of education obtained in the household.
Table 6
| Highest obtained education in the household | Mean | t-statistic |
| High School | 10 | 6.8799 |
| Some College | 9 | 6.8799 |
Note. p<.05*, p<.01**, p<.001***
The independent variable is highest education in the household. This variable is the question “What is the highest degree of education anyone in your household has completed?”. The answers that may be selected are as follows: 1. Less than High School, 2. High School, 3. Some College, 4. College degree or higher, 5. Prefer not to answer. This variable was recoded into two groups. The first group contains answer 1, which is High School. This group is named “High School”, as seen in Table 1. The second group contains answers 3 and 4, which are Some College and College degree or higher. This group is named “Some College”, which is also seen in Table 1. The dependent variable is Encouragement. This variable is the question “Did the Astronaut Pudding Activity encourage your family to spend time together?”. The answers provided for this question is a scale from 0 to 10, 0 meaning not at all and 10 meaning greatly. This variable was recoded into three groups. The first groups is named “Not Encouraged”, having answers from -.5 to 2.5. The second group is named “Slightly Encouraged”, having answers falling in between 2.5 and 7.5. The third group is named “Encouraged”, having answers from 7.5 and up. The mean for High School is 10 and the mean for Some College is 9. This shows that respondents with a higher education obtained in the household answered slightly less than the respondents who have a lower education obtained in the household. With a p-value of 1.948e-09, which is a *** due to the p-value being less than .001, this means there is a significant difference between the means.